

Technique of Measuring Phytoplankton Primary Production
49
Both these curves of Cpd and of Ks describe the same phenomenon - the
change in phytoplankton photosynthesis rates with depth. Therefore their
form at a given station should, in principle, be equal. In practice, the Cpd curves
are more similar to an idealized photosynthesis-depth curve, basically
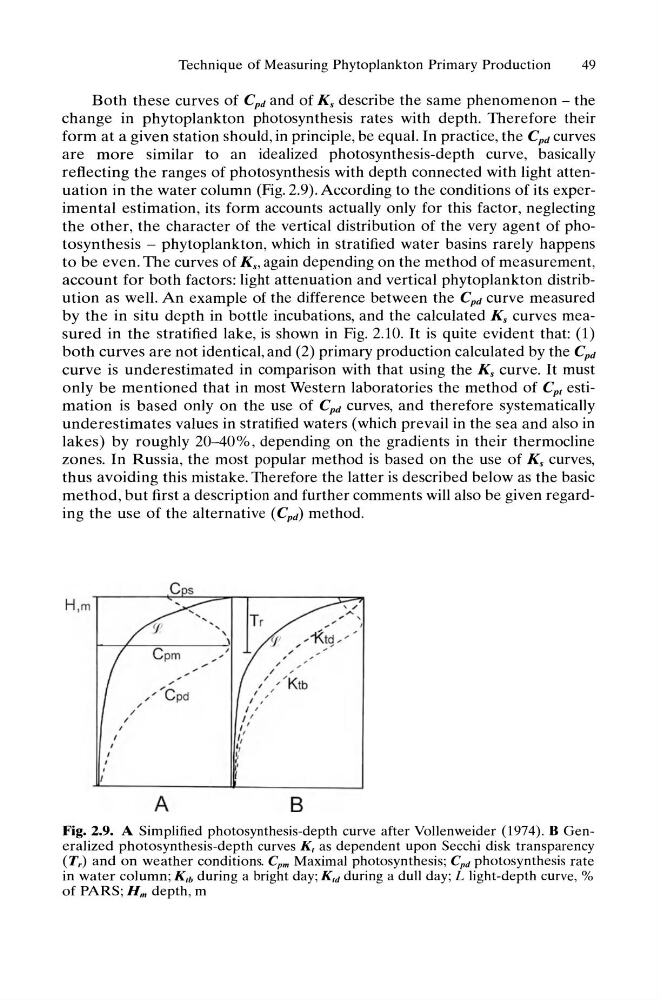
reflecting the ranges of photosynthesis with depth connected with light attenuation in the water column (Fig. 2.9). According to the conditions of its experimental estimation, its form accounts actually only for this factor, neglecting
the other, the character of the vertical distribution of the very agent of photosynthesis - phytoplankton, which in stratified water basins rarely happens
to be even. The curves of K" again depending on the method of measurement,
account for both factors: light attenuation and vertical phytoplankton distribution as well. An example of the difference between the Cpd curve measured
by the in situ depth in bottle incubations, and the calculated Ks curves measured in the stratified lake, is shown in Fig. 2.10. It is quite evident that: (1)
both curves are not identical, and (2) primary production calculated by the Cpd
curve is underestimated in comparison with that using the Ks curve. It must
only be mentioned that in most Western laboratories the method of Cpt estimation is based only on the use of Cpd curves, and therefore systematically
underestimates values in stratified waters (which prevail in the sea and also in
lakes) by roughly 20-40%, depending on the gradients in their thermocline
zones. In Russia, the most popular method is based on the use of Ks curves,
thus avoiding this mistake. Therefore the latter is described below as the basic
method, but first a description and further comments will also be given regarding the use of the alternative (Cpd) method.
H.m
I
t
/
/
/
C pm
"
/"Cpd
A
, ,
B
Fig. 2.9. A Simplified photosynthesis-depth curve after Vollenweider (1974). B Generalized photosynthesis-depth curves K t as dependent upon Secchi disk transparency
(Tr) and on weather conditions. Cpm Maximal photosynthesis; Cpd photosynthesis rate
in water column; K'b during a bright day; K'd during a dull day; L light-depth curve, %
of PARS; Hm depth, m
49
Both these curves of Cpd and of Ks describe the same phenomenon - the
change in phytoplankton photosynthesis rates with depth. Therefore their
form at a given station should, in principle, be equal. In practice, the Cpd curves
are more similar to an idealized photosynthesis-depth curve, basically
reflecting the ranges of photosynthesis with depth connected with light attenuation in the water column (Fig. 2.9). According to the conditions of its experimental estimation, its form accounts actually only for this factor, neglecting
the other, the character of the vertical distribution of the very agent of photosynthesis - phytoplankton, which in stratified water basins rarely happens
to be even. The curves of K" again depending on the method of measurement,
account for both factors: light attenuation and vertical phytoplankton distribution as well. An example of the difference between the Cpd curve measured
by the in situ depth in bottle incubations, and the calculated Ks curves measured in the stratified lake, is shown in Fig. 2.10. It is quite evident that: (1)
both curves are not identical, and (2) primary production calculated by the Cpd
curve is underestimated in comparison with that using the Ks curve. It must
only be mentioned that in most Western laboratories the method of Cpt estimation is based only on the use of Cpd curves, and therefore systematically
underestimates values in stratified waters (which prevail in the sea and also in
lakes) by roughly 20-40%, depending on the gradients in their thermocline
zones. In Russia, the most popular method is based on the use of Ks curves,
thus avoiding this mistake. Therefore the latter is described below as the basic
method, but first a description and further comments will also be given regarding the use of the alternative (Cpd) method.
H.m
I
t
/
/
/
C pm
"
/"Cpd
A
, ,
B
Fig. 2.9. A Simplified photosynthesis-depth curve after Vollenweider (1974). B Generalized photosynthesis-depth curves K t as dependent upon Secchi disk transparency
(Tr) and on weather conditions. Cpm Maximal photosynthesis; Cpd photosynthesis rate
in water column; K'b during a bright day; K'd during a dull day; L light-depth curve, %
of PARS; Hm depth, m