

17 Irrigation and Drainage
387
reliability of the method, the information is not very different from the information
on land cover.
Monitoring of irrigation systems. Assessment and monitoring of the performance of irrigation systems can be accomplished by combining remotely sensed data
with diverse ancillary data. The example given here is based on the approach
described by Menenti et al. (1990). To measure the relation of diverted water
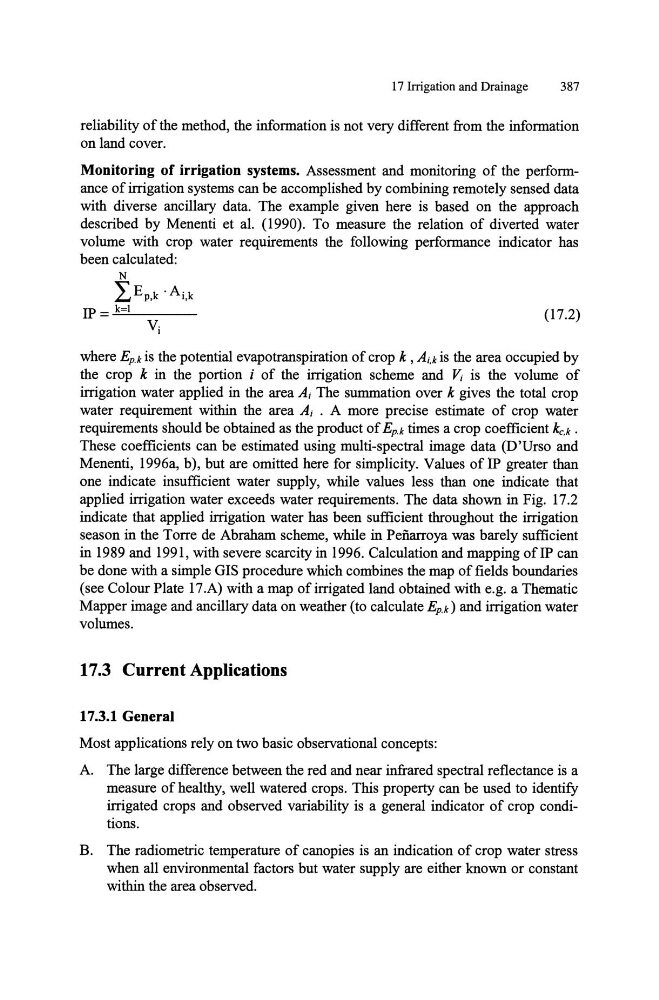
volume with crop water requirements the following performance indicator has
been calculated:
N
~Ek·A-k
£.J p,
I,
IP = .."k::e=I'--_ _ _
(17.2)
where Ep.k is the potential evapotranspiration of crop k , Ai,k is the area occupied by
the crop k in the portion i of the irrigation scheme and ~ is the volume of
irrigation water applied in the area Ai The summation over k gives the total crop
water requirement within the area Ai . A more precise estimate of crop water
requirements should be obtained as the product of Ep.k times a crop coefficient kc,k .
These coefficients can be estimated using multi-spectral image data (D'Urso and
Menenti, 1996a, b), but are omitted here for simplicity. Values ofIP greater than
one indicate insufficient water supply, while values less than one indicate that
applied irrigation water exceeds water requirements. The data shown in Fig. 17.2
indicate that applied irrigation water has been sufficient throughout the irrigation
season in the Torre de Abraham scheme, while in Peiiarroya was barely sufficient
in 1989 and 1991, with severe scarcity in 1996. Calculation and mapping ofIP can
be done with a simple GIS procedure which combines the map of fields boundaries
(see Colour Plate 17.A) with a map of irrigated land obtained with e.g. a Thematic
Mapper image and ancillary data on weather (to calculate Ep.k) and irrigation water
volumes.
17.3 Current Applications
17.3.1 General
Most applications rely on two basic observational concepts:
A. The large difference between the red and near infrared spectral reflectance is a
measure of healthy, well watered crops. This property can be used to identify
irrigated crops and observed variability is a general indicator of crop conditions.
B. The radiometric temperature of canopies is an indication of crop water stress
when all environmental factors but water supply are either known or constant
within the area observed.
387
reliability of the method, the information is not very different from the information
on land cover.
Monitoring of irrigation systems. Assessment and monitoring of the performance of irrigation systems can be accomplished by combining remotely sensed data
with diverse ancillary data. The example given here is based on the approach
described by Menenti et al. (1990). To measure the relation of diverted water
volume with crop water requirements the following performance indicator has
been calculated:
N
~Ek·A-k
£.J p,
I,
IP = .."k::e=I'--_ _ _
(17.2)
where Ep.k is the potential evapotranspiration of crop k , Ai,k is the area occupied by
the crop k in the portion i of the irrigation scheme and ~ is the volume of
irrigation water applied in the area Ai The summation over k gives the total crop
water requirement within the area Ai . A more precise estimate of crop water
requirements should be obtained as the product of Ep.k times a crop coefficient kc,k .
These coefficients can be estimated using multi-spectral image data (D'Urso and
Menenti, 1996a, b), but are omitted here for simplicity. Values ofIP greater than
one indicate insufficient water supply, while values less than one indicate that
applied irrigation water exceeds water requirements. The data shown in Fig. 17.2
indicate that applied irrigation water has been sufficient throughout the irrigation
season in the Torre de Abraham scheme, while in Peiiarroya was barely sufficient
in 1989 and 1991, with severe scarcity in 1996. Calculation and mapping ofIP can
be done with a simple GIS procedure which combines the map of fields boundaries
(see Colour Plate 17.A) with a map of irrigated land obtained with e.g. a Thematic
Mapper image and ancillary data on weather (to calculate Ep.k) and irrigation water
volumes.
17.3 Current Applications
17.3.1 General
Most applications rely on two basic observational concepts:
A. The large difference between the red and near infrared spectral reflectance is a
measure of healthy, well watered crops. This property can be used to identify
irrigated crops and observed variability is a general indicator of crop conditions.
B. The radiometric temperature of canopies is an indication of crop water stress
when all environmental factors but water supply are either known or constant
within the area observed.