

16 Flood Forecasting and Control
367
The following sections show the various steps of the procedure of flood forecasting and control.
16.3.2Radar Rainfall Measurements in the Gfinz River Catchment
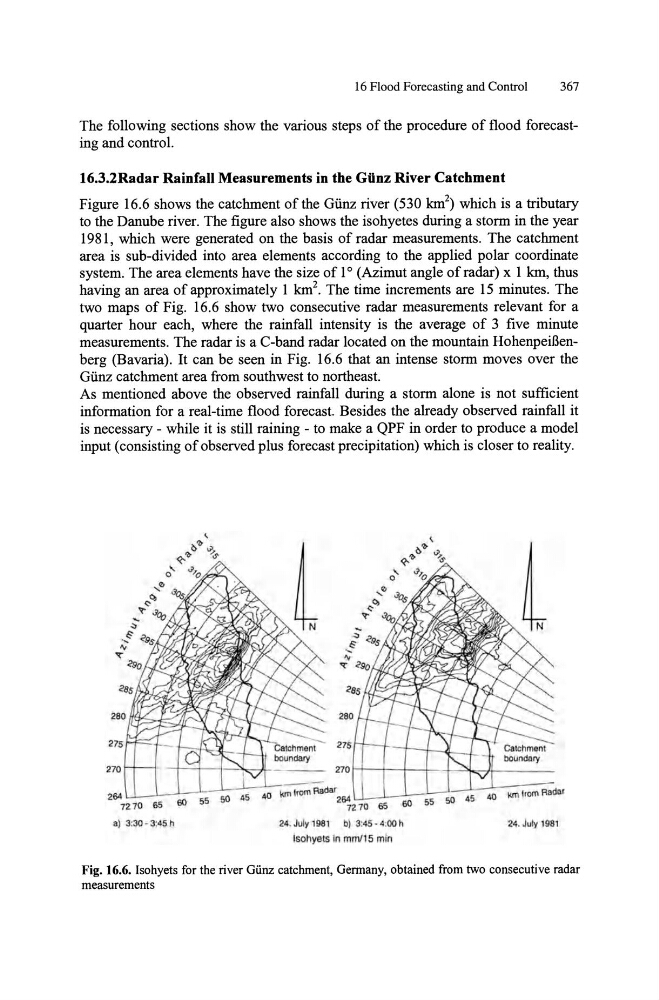
Figure 16.6 shows the catchment of the Giinz river (530 km 2 ) which is a tributary
to the Danube river. The figure also shows the isohyetes during a storm in the year
1981, which were generated on the basis of radar measurements. The catchment
area is sub-divided into area elements according to the applied polar coordinate
system. The area elements have the size of 1 0 (Azimut angle of radar) x 1 km, thus
having an area of approximately 1 km 2 • The time increments are 15 minutes. The
two maps of Fig. 16.6 show two consecutive radar measurements relevant for a
quarter hour each, where the rainfall intensity is the average of 3 five minute
measurements. The radar is a C-band radar located on the mountain HohenpeiBenberg (Bavaria). It can be seen in Fig. 16.6 that an intense storm moves over the
Giinz catchment area from southwest to northeast.
As mentioned above the observed rainfall during a storm alone is not sufficient
information for a real-time flood forecast. Besides the already observed rainfall it
is necessary - while it is still raining - to make a QPF in order to produce a model
input (consisting of observed plus forecast precipitation) which is closer to reality.
275
270
270 tT-I--t--t---f-"I-=:,-II-- - - -
264
7
L 2 7 LO --' o'- 5 --' o-n -- -..J..-.-L-~ .- n~R;;:dat
u
uu 55 50 45 ""
2"i2 70 &5 &0
-
\J...-JL..L-+~1~~~0~; m Irom Radar
a) 3:30·3:45 h
24. July 1981 b) 3:45 · 4:00 h
24. July 1981
Isohyels in mml15 min
Fig. 16.6. Isohyets for the river Gunz catchment, Gennany, obtained from two consecutive radar
measurements
367
The following sections show the various steps of the procedure of flood forecasting and control.
16.3.2Radar Rainfall Measurements in the Gfinz River Catchment
Figure 16.6 shows the catchment of the Giinz river (530 km 2 ) which is a tributary
to the Danube river. The figure also shows the isohyetes during a storm in the year
1981, which were generated on the basis of radar measurements. The catchment
area is sub-divided into area elements according to the applied polar coordinate
system. The area elements have the size of 1 0 (Azimut angle of radar) x 1 km, thus
having an area of approximately 1 km 2 • The time increments are 15 minutes. The
two maps of Fig. 16.6 show two consecutive radar measurements relevant for a
quarter hour each, where the rainfall intensity is the average of 3 five minute
measurements. The radar is a C-band radar located on the mountain HohenpeiBenberg (Bavaria). It can be seen in Fig. 16.6 that an intense storm moves over the
Giinz catchment area from southwest to northeast.
As mentioned above the observed rainfall during a storm alone is not sufficient
information for a real-time flood forecast. Besides the already observed rainfall it
is necessary - while it is still raining - to make a QPF in order to produce a model
input (consisting of observed plus forecast precipitation) which is closer to reality.
275
270
270 tT-I--t--t---f-"I-=:,-II-- - - -
264
7
L 2 7 LO --' o'- 5 --' o-n -- -..J..-.-L-~ .- n~R;;:dat
u
uu 55 50 45 ""
2"i2 70 &5 &0
-
\J...-JL..L-+~1~~~0~; m Irom Radar
a) 3:30·3:45 h
24. July 1981 b) 3:45 · 4:00 h
24. July 1981
Isohyels in mml15 min
Fig. 16.6. Isohyets for the river Gunz catchment, Gennany, obtained from two consecutive radar
measurements