

364
G.A. Schultz
obtained during the last time interval. If a deviation between the computed flood
hydrograph and the observed hydro graph (until the time offorecasts) is evident, it
has to be assumed that this difference is due to false model parameter values. This
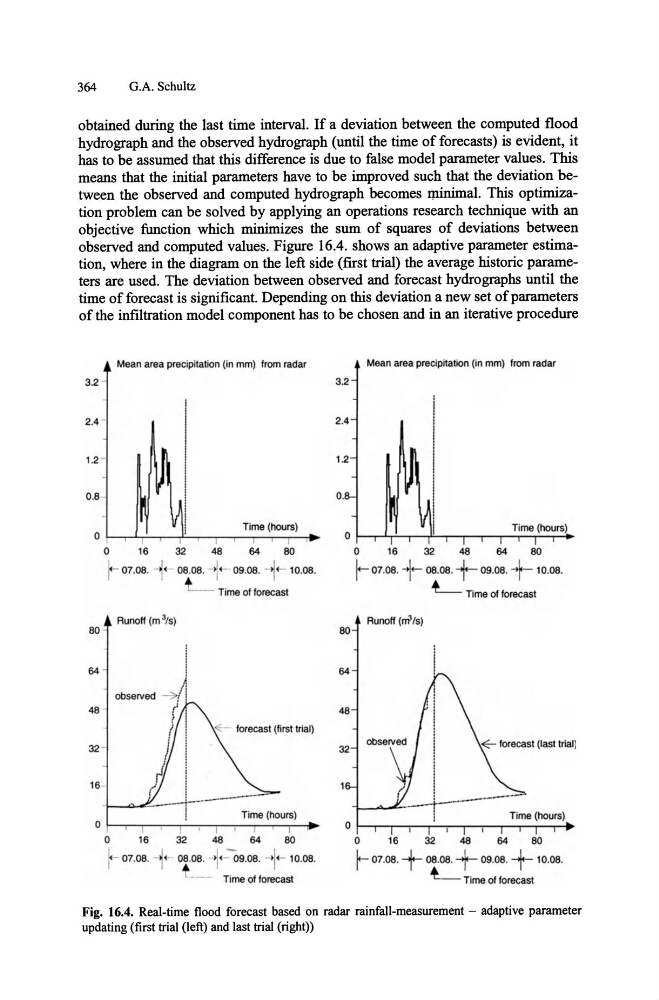
means that the initial parameters have to be improved such that the deviation between the observed and computed hydro graph becomes minimal. This optimization problem can be solved by applying an operations research technique with an
objective function which minimizes the sum of squares of deviations between
observed and computed values. Figure 16.4. shows an adaptive parameter estimation, where in the diagram on the left side (first trial) the average historic parameters are used. The deviation between observed and forecast hydro graphs until the
time of forecast is significant. Depending on this deviation a new set of parameters
of the infiltration model component has to be chosen and in an iterative procedure
Mean area precipitation (in mm) from radar
3.2
0.8 -
o
I
I
64
o
16
32
48
80
1- 07.08. - <- 08.08. -
09.08. - .- 10.08.
+ - - Time of forecast
Runoff (m%)
80
64
observed
48 -
- forecast (first trial)
32
160
I
I
Time (hours)
I
0
16
32
48
64
80
I 07.08. _1.- ~.08. - + -0 9.08. -+-10. 08.
L ___
Ti me of forecast
3.2
2.4
80
64
48
32
Mean area preCipitation (in mm) from radar
o
16
32
48
64
80
r-07. 08. +-08. 08. + 09.08. + 10.08.
~ Time of forecast
Runoff (nil/s)
~ forecast (last trial)
o
16
32
48
64
80
r 07.08. + 08.08. + 09.08. + 10.08.
L.... Time of forecast
Fig. 16.4. Real-time flood forecast based on radar rainfall-measurement - adaptive parameter
updating (first trial (left) and last trial (right))
G.A. Schultz
obtained during the last time interval. If a deviation between the computed flood
hydrograph and the observed hydro graph (until the time offorecasts) is evident, it
has to be assumed that this difference is due to false model parameter values. This
means that the initial parameters have to be improved such that the deviation between the observed and computed hydro graph becomes minimal. This optimization problem can be solved by applying an operations research technique with an
objective function which minimizes the sum of squares of deviations between
observed and computed values. Figure 16.4. shows an adaptive parameter estimation, where in the diagram on the left side (first trial) the average historic parameters are used. The deviation between observed and forecast hydro graphs until the
time of forecast is significant. Depending on this deviation a new set of parameters
of the infiltration model component has to be chosen and in an iterative procedure
Mean area precipitation (in mm) from radar
3.2
0.8 -
o
I
I
64
o
16
32
48
80
1- 07.08. - <- 08.08. -
09.08. - .- 10.08.
+ - - Time of forecast
Runoff (m%)
80
64
observed
48 -
- forecast (first trial)
32
160
I
I
Time (hours)
I
0
16
32
48
64
80
I 07.08. _1.- ~.08. - + -0 9.08. -+-10. 08.
L ___
Ti me of forecast
3.2
2.4
80
64
48
32
Mean area preCipitation (in mm) from radar
o
16
32
48
64
80
r-07. 08. +-08. 08. + 09.08. + 10.08.
~ Time of forecast
Runoff (nil/s)
~ forecast (last trial)
o
16
32
48
64
80
r 07.08. + 08.08. + 09.08. + 10.08.
L.... Time of forecast
Fig. 16.4. Real-time flood forecast based on radar rainfall-measurement - adaptive parameter
updating (first trial (left) and last trial (right))