

13 Water Quality
295
5 .-----------------------------------,
4
Chlorophyll (mglm 3)
600
Wavelength (nm)
800
1000
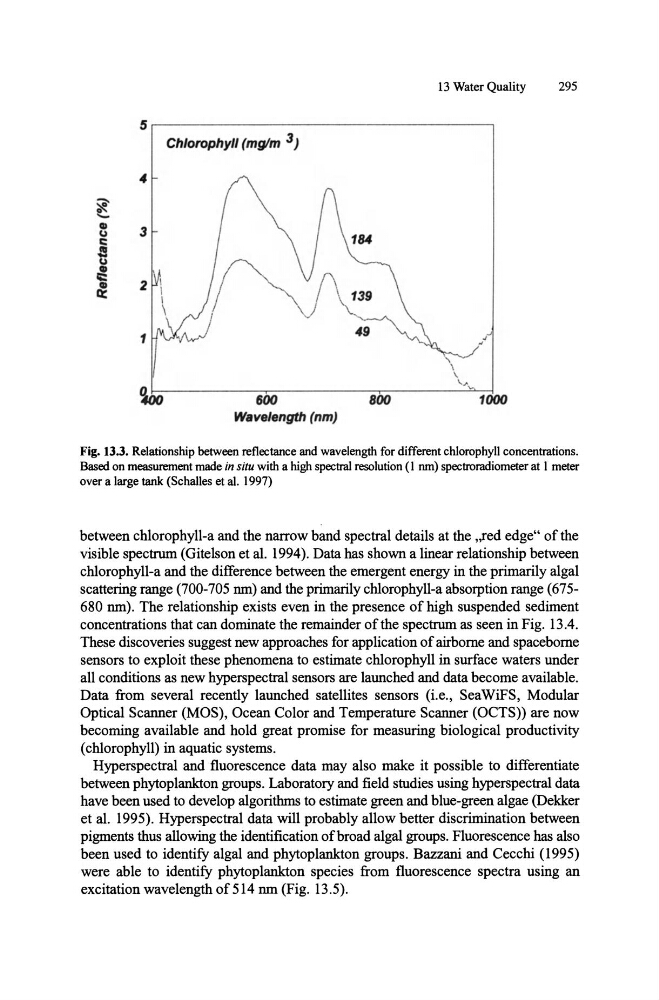
Fig. 13.3. Relationship between reflectance and wavelength for different chlorophyll concentrations.
Based on measurement made in situ with a high spectral resolution (I nm) spectroradiometer at I meter
over a large tank (Schalles et al. 1997)
between chlorophyll-a and the narrow band spectral details at the ,,red edge" of the
visible spectrum (Gitelson et al. 1994). Data has shown a linear relationship between
chlorophyll-a and the difference between the emergent energy in the primarily algal
scattering range (700-705 nro) and the primarily chlorophyll-a absorption range (675680 nro). The relationship exists even in the presence of high suspended sediment
concentrations that can dominate the remainder of the spectrum as seen in Fig. l3.4.
These discoveries suggest new approaches for application of airborne and spaceborne
sensors to exploit these phenomena to estimate chlorophyll in surface waters under
all conditions as new hyperspectral sensors are launched and data become available.
Data from several recently launched satellites sensors (i.e., SeaWiFS, Modular
Optical Scanner (MOS), Ocean Color and Temperature Scanner (OCTS)) are now
becoming available and hold great promise for measuring biological productivity
(chlorophyll) in aquatic systems.
Hyperspectral and fluorescence data may also make it possible to differentiate
between phytoplankton groups. Laboratory and field studies using hyperspectral data
have been used to develop algorithms to estimate green and blue-green algae (Dekker
et al. 1995). Hyperspectral data will probably allow better discrimination between
pigments thus allowing the identification of broad algal groups. Fluorescence has also
been used to identify algal and phytoplankton groups. Bazzani and Cecchi (1995)
were able to identify phytoplankton species from fluorescence spectra using an
excitation wavelength of5l4 nro (Fig. l3.5).
295
5 .-----------------------------------,
4
Chlorophyll (mglm 3)
600
Wavelength (nm)
800
1000
Fig. 13.3. Relationship between reflectance and wavelength for different chlorophyll concentrations.
Based on measurement made in situ with a high spectral resolution (I nm) spectroradiometer at I meter
over a large tank (Schalles et al. 1997)
between chlorophyll-a and the narrow band spectral details at the ,,red edge" of the
visible spectrum (Gitelson et al. 1994). Data has shown a linear relationship between
chlorophyll-a and the difference between the emergent energy in the primarily algal
scattering range (700-705 nro) and the primarily chlorophyll-a absorption range (675680 nro). The relationship exists even in the presence of high suspended sediment
concentrations that can dominate the remainder of the spectrum as seen in Fig. l3.4.
These discoveries suggest new approaches for application of airborne and spaceborne
sensors to exploit these phenomena to estimate chlorophyll in surface waters under
all conditions as new hyperspectral sensors are launched and data become available.
Data from several recently launched satellites sensors (i.e., SeaWiFS, Modular
Optical Scanner (MOS), Ocean Color and Temperature Scanner (OCTS)) are now
becoming available and hold great promise for measuring biological productivity
(chlorophyll) in aquatic systems.
Hyperspectral and fluorescence data may also make it possible to differentiate
between phytoplankton groups. Laboratory and field studies using hyperspectral data
have been used to develop algorithms to estimate green and blue-green algae (Dekker
et al. 1995). Hyperspectral data will probably allow better discrimination between
pigments thus allowing the identification of broad algal groups. Fluorescence has also
been used to identify algal and phytoplankton groups. Bazzani and Cecchi (1995)
were able to identify phytoplankton species from fluorescence spectra using an
excitation wavelength of5l4 nro (Fig. l3.5).