

7 Land-use and Catchment Characteristics
143
A variety of classifications methods exists. A first distinction is between unsupervised and supervised classification.
Unsupervised Classification. A classification can be obtained by plotting all feature vectors of the image in a feature space, and then analyzing the feature space
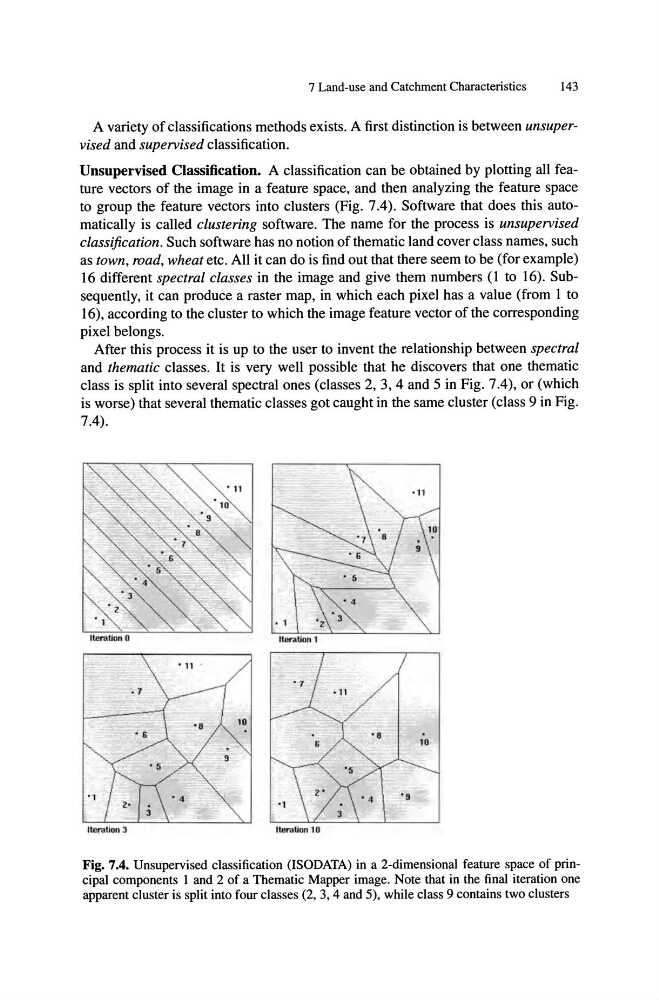
to group the feature vectors into clusters (Fig. 7.4). Software that does this automatically is called clustering software. The name for the process is unsupervised
classification. Such software has no notion of thematic land cover class names, such
as town, road, wheat etc. All it can do is find out that there seem to be (for example)
16 different spectral classes in the image and give them numbers (1 to 16). Subsequently, it can produce a raster map, in which each pixel has a value (from I to
16), according to the cluster to which the image feature vector of the corresponding
pixel belongs.
After this process it is up to the user to invent the relationship between spectral
and thematic classes. It is very well possible that he discovers that one thematic
class is split into several spectral ones (classes 2,3,4 and 5 in Fig. 7.4), or (which
is worse) that several thematic classes got caught in the same cluster (class 9 in Fig.
7.4).
Fig. 7.4. Unsupervised classification (ISODATA) in a 2-dimensional feature space of principal components 1 and 2 of a Thematic Mapper image. Note that in the final iteration one
apparent cluster is split into four classes (2, 3, 4 and 5), while class 9 contains two clusters
143
A variety of classifications methods exists. A first distinction is between unsupervised and supervised classification.
Unsupervised Classification. A classification can be obtained by plotting all feature vectors of the image in a feature space, and then analyzing the feature space
to group the feature vectors into clusters (Fig. 7.4). Software that does this automatically is called clustering software. The name for the process is unsupervised
classification. Such software has no notion of thematic land cover class names, such
as town, road, wheat etc. All it can do is find out that there seem to be (for example)
16 different spectral classes in the image and give them numbers (1 to 16). Subsequently, it can produce a raster map, in which each pixel has a value (from I to
16), according to the cluster to which the image feature vector of the corresponding
pixel belongs.
After this process it is up to the user to invent the relationship between spectral
and thematic classes. It is very well possible that he discovers that one thematic
class is split into several spectral ones (classes 2,3,4 and 5 in Fig. 7.4), or (which
is worse) that several thematic classes got caught in the same cluster (class 9 in Fig.
7.4).
Fig. 7.4. Unsupervised classification (ISODATA) in a 2-dimensional feature space of principal components 1 and 2 of a Thematic Mapper image. Note that in the final iteration one
apparent cluster is split into four classes (2, 3, 4 and 5), while class 9 contains two clusters