

6 Precipitation
123
Errors over the whole observing area are 5-10%. The method is called the 'HeightArea Rainfall Threshold" or HART method. Morrisey (1994) examined the effect of
data resolution on this and the AT! techniques. The results indicated that significant
biases and random errors can arise when using data having spatial resolutions
different from those used to calibrate the method.
6.3.5 Bispectral techniques
Radar systems can make measurements of precipitation over wide areas from a single
location in real time, and are easier and more cost effective to operate than extensive
raingauge networks. It is therefore attractive to design procedures to combine the
radar data with satellite data in order to better understand the relationships between
variations in visible and infrared or microwave brightness temperatures and rainfall.
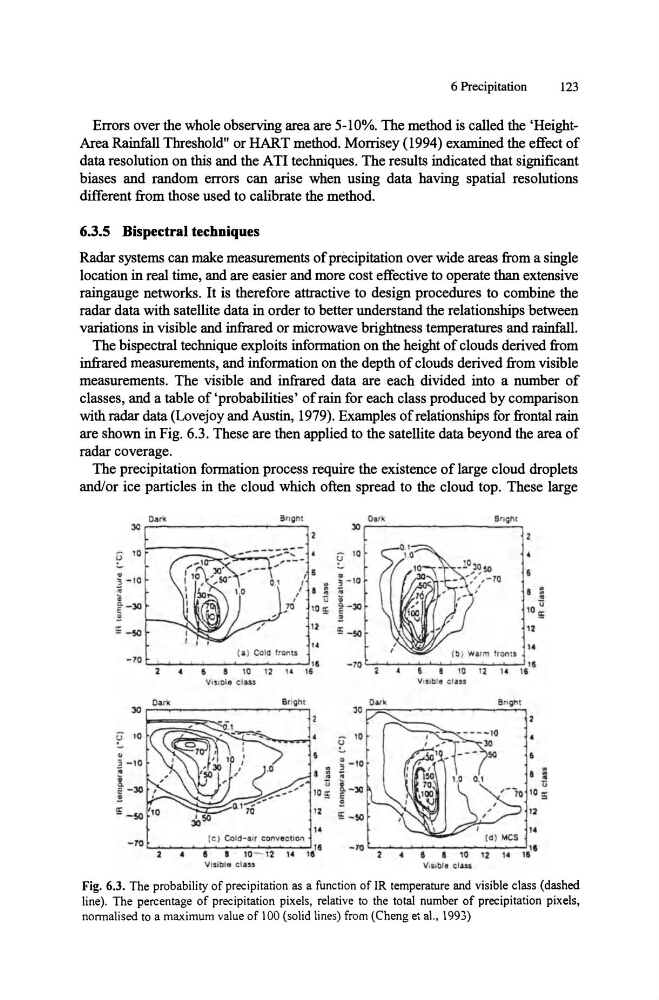
The bispectral technique exploits information on the height of clouds derived from
infrared measurements, and information on the depth of clouds derived from visible
measurements. The visible and infrared data are each divided into a number of
classes, and a table of 'probabilities' of rain for each class produced by comparison
with radar data (Lovejoy and Austin, 1979). Examples of relationships for frontal rain
are shown in Fig. 6.3. These are then applied to the satellite data beyond the area of
radar coverage.
The precipitation formation process require the existence of large cloud droplets
and/or ice particles in the cloud which often spread to the cloud top. These large
O.rk
arlgnt
30
U 10
. .
( 6
3 -10
,
~
I
I
n
I
~
1- 30
,-.0
' "
' 0 g;
5:_ 50
'2
"
-70
( a ) Co'd fron'"
11
6
10
12 u
16
Vis, cia elus
Da rk
30
Bright
U 10
12
,.
-TO
[C) Cold-air c o n'Y ec~ i on
16
• a
10- 12 ,. 11
Visible C la3.,
lO
~
10
~
~ -1 0
OJ
i
,, -30
!
g;-50
-70
JO
10
;>
~ -10
;;
i-3O e
.!!
-TO
Oar'll
14
~~~-7~~~~~~~.I6
10 ' 2 ,. 16
VISible clau
OM"
B"'gnt
Fig. 6.3. The probability of precipitation as a function of IR temperature and visible class (dashed
line), The percentage of precipitation pixels, relative to the total number of precipitation pixels,
nonnalised to a maximum value of 100 (solid lines) from (Cheng e, a1., 1993)
123
Errors over the whole observing area are 5-10%. The method is called the 'HeightArea Rainfall Threshold" or HART method. Morrisey (1994) examined the effect of
data resolution on this and the AT! techniques. The results indicated that significant
biases and random errors can arise when using data having spatial resolutions
different from those used to calibrate the method.
6.3.5 Bispectral techniques
Radar systems can make measurements of precipitation over wide areas from a single
location in real time, and are easier and more cost effective to operate than extensive
raingauge networks. It is therefore attractive to design procedures to combine the
radar data with satellite data in order to better understand the relationships between
variations in visible and infrared or microwave brightness temperatures and rainfall.
The bispectral technique exploits information on the height of clouds derived from
infrared measurements, and information on the depth of clouds derived from visible
measurements. The visible and infrared data are each divided into a number of
classes, and a table of 'probabilities' of rain for each class produced by comparison
with radar data (Lovejoy and Austin, 1979). Examples of relationships for frontal rain
are shown in Fig. 6.3. These are then applied to the satellite data beyond the area of
radar coverage.
The precipitation formation process require the existence of large cloud droplets
and/or ice particles in the cloud which often spread to the cloud top. These large
O.rk
arlgnt
30
U 10
. .
( 6
3 -10
,
~
I
I
n
I
~
1- 30
,-.0
' "
' 0 g;
5:_ 50
'2
"
-70
( a ) Co'd fron'"
11
6
10
12 u
16
Vis, cia elus
Da rk
30
Bright
U 10
12
,.
-TO
[C) Cold-air c o n'Y ec~ i on
16
• a
10- 12 ,. 11
Visible C la3.,
lO
~
10
~
~ -1 0
OJ
i
,, -30
!
g;-50
-70
JO
10
;>
~ -10
;;
i-3O e
.!!
-TO
Oar'll
14
~~~-7~~~~~~~.I6
10 ' 2 ,. 16
VISible clau
OM"
B"'gnt
Fig. 6.3. The probability of precipitation as a function of IR temperature and visible class (dashed
line), The percentage of precipitation pixels, relative to the total number of precipitation pixels,
nonnalised to a maximum value of 100 (solid lines) from (Cheng e, a1., 1993)