

THE NEAR-SURFACE LAYER OF THE OCEAN
convection at large Rayleigh numbers that represented turbulent convection
as the following cyclic process: The thermal boundary layer forms by
diffusion, grows until it is thick enough to develop convective instability,
and is destroyed by convection, which in turn dies down once the boundary
layer is destroyed. Then the cycle begins again.
The convective period at the ocean surface is of the order of tens of
seconds only; the horizontal length scale of the convective cells is about 1
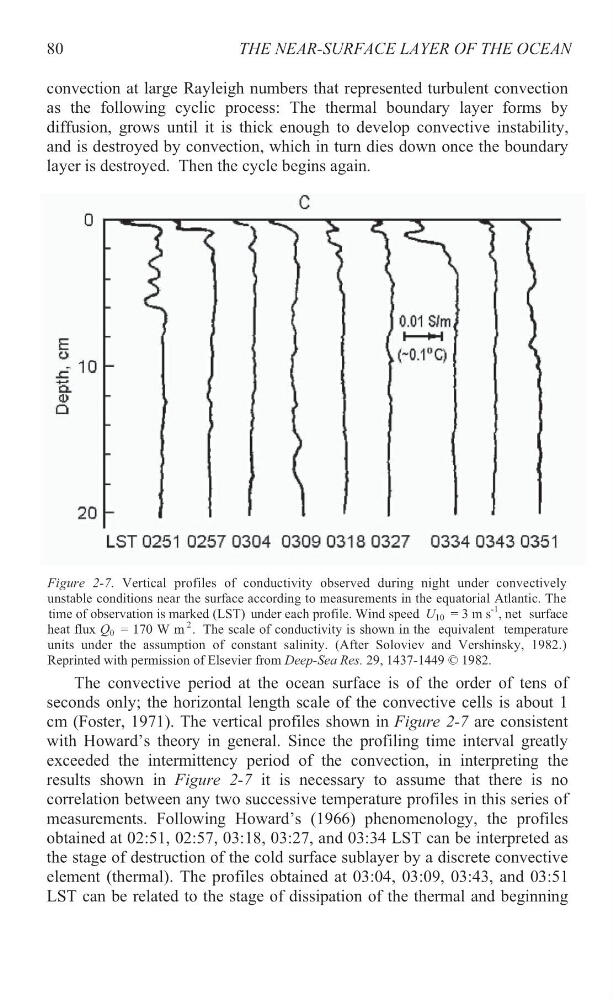
cm (Foster, 1971). The vertical profiles shown in Figure 2-7 are consistent
with Howard’s theory in general. Since the profiling time interval greatly
exceeded the intermittency period of the convection, in interpreting the
results shown in Figure 2-7 it is necessary to assume that there is no
correlation between any two successive temperature profiles in this series of
measurements. Following Howard’s (1966) phenomenology, the profiles
obtained at 02:51, 02:57, 03:18, 03:27, and 03:34 LST can be interpreted as
the stage of destruction of the cold surface sublayer by a discrete convective
element (thermal). The profiles obtained at 03:04, 03:09, 03:43, and 03:51
LST can be related to the stage of dissipation of the thermal and beginning
80
Figure 2-7. Vertical profiles of conductivity observed during night under convectively
unstable conditions near the surface according to measurements in the equatorial Atlantic. The
time of observation is marked (LST) under each profile. Wind speed U 10 = 3 m s
-1 , net surface
heat flux Q 0 = 170 W m
2 . The scale of conductivity is shown in the equivalent temperature
units under the assumption of constant salinity. (After Soloviev and Vershinsky, 1982.)
Reprinted with permission of Elsevier from Deep-Sea Res. 29, 1437-1449 © 1982.
convection at large Rayleigh numbers that represented turbulent convection
as the following cyclic process: The thermal boundary layer forms by
diffusion, grows until it is thick enough to develop convective instability,
and is destroyed by convection, which in turn dies down once the boundary
layer is destroyed. Then the cycle begins again.
The convective period at the ocean surface is of the order of tens of
seconds only; the horizontal length scale of the convective cells is about 1
cm (Foster, 1971). The vertical profiles shown in Figure 2-7 are consistent
with Howard’s theory in general. Since the profiling time interval greatly
exceeded the intermittency period of the convection, in interpreting the
results shown in Figure 2-7 it is necessary to assume that there is no
correlation between any two successive temperature profiles in this series of
measurements. Following Howard’s (1966) phenomenology, the profiles
obtained at 02:51, 02:57, 03:18, 03:27, and 03:34 LST can be interpreted as
the stage of destruction of the cold surface sublayer by a discrete convective
element (thermal). The profiles obtained at 03:04, 03:09, 03:43, and 03:51
LST can be related to the stage of dissipation of the thermal and beginning
80
Figure 2-7. Vertical profiles of conductivity observed during night under convectively
unstable conditions near the surface according to measurements in the equatorial Atlantic. The
time of observation is marked (LST) under each profile. Wind speed U 10 = 3 m s
-1 , net surface
heat flux Q 0 = 170 W m
2 . The scale of conductivity is shown in the equivalent temperature
units under the assumption of constant salinity. (After Soloviev and Vershinsky, 1982.)
Reprinted with permission of Elsevier from Deep-Sea Res. 29, 1437-1449 © 1982.