

Chapter 7: APPLICATIONS
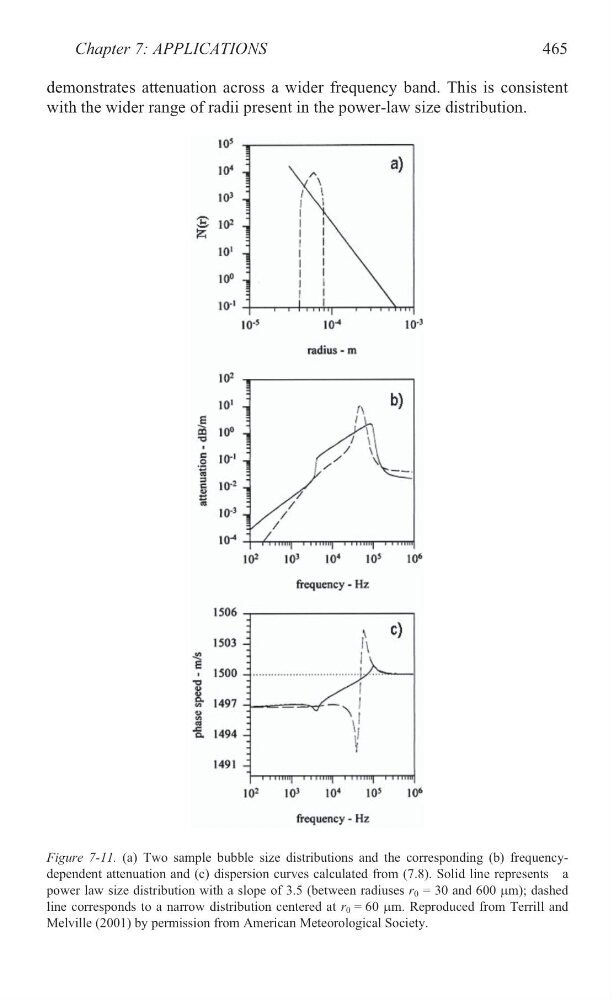
demonstrates attenuation across a wider frequency band. This is consistent
with the wider range of radii present in the power-law size distribution.
465
Figure 7-11. (a) Two sample bubble size distributions and the corresponding (b) frequencydependent attenuation and (c) dispersion curves calculated from (7.8). Solid line represents a
power law size distribution with a slope of 3.5 (between radiuses r 0 = 30 and 600 Pm); dashed
line corresponds to a narrow distribution centered at r 0 = 60 Pm. Reproduced from Terrill and
Melville (2001) by permission from American Meteorological Society.
demonstrates attenuation across a wider frequency band. This is consistent
with the wider range of radii present in the power-law size distribution.
465
Figure 7-11. (a) Two sample bubble size distributions and the corresponding (b) frequencydependent attenuation and (c) dispersion curves calculated from (7.8). Solid line represents a
power law size distribution with a slope of 3.5 (between radiuses r 0 = 30 and 600 Pm); dashed
line corresponds to a narrow distribution centered at r 0 = 60 Pm. Reproduced from Terrill and
Melville (2001) by permission from American Meteorological Society.