

flux is higher for colder water; above 0.2 µm D p the number flux is higher
for warmer water.
Gong et al. (1997) and Lohmann et al. (2000) extrapolated the Monahan
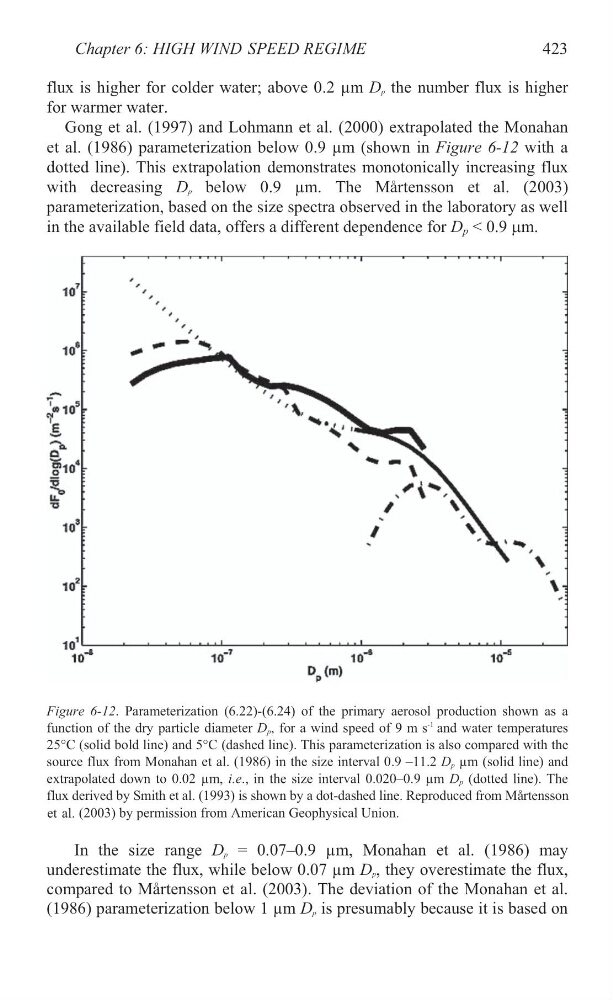
et al. (1986) parameterization below 0.9 µm (shown in Figure 6-12 with a
dotted line). This extrapolation demonstrates monotonically increasing flux
with decreasing D p below 0.9 µm. The Mårtensson et al. (2003)
parameterization, based on the size spectra observed in the laboratory as well
in the available field data, offers a different dependence for D p < 0.9 Pm.
Figure 6-12. Parameterization (6.22)-(6.24) of the primary aerosol production shown as a
function of the dry particle diameter D p , for a wind speed of 9 m s
-1 and water temperatures
25°C (solid bold line) and 5°C (dashed line). This parameterization is also compared with the
source flux from Monahan et al. (1986) in the size interval 0.9 –11.2 D p µm (solid line) and
extrapolated down to 0.02 µm, i.e., in the size interval 0.020–0.9 µm D p (dotted line). The
In the size range D p = 0.07–0.9 µm, Monahan et al. (1986) may
underestimate the flux, while below 0.07 µm D p , they overestimate the flux,
compared to Mårtensson et al. (2003). The deviation of the Monahan et al.
(1986) parameterization below 1 µm D p is presumably because it is based on
Chapter 6: HIGH WIND SPEED REGIME
423
flux derived by Smith et al. (1993) is shown by a dot-dashed line. Reproduced from Mårtensson
et al. (2003) by permission from American Geophysical Union.
for warmer water.
Gong et al. (1997) and Lohmann et al. (2000) extrapolated the Monahan
et al. (1986) parameterization below 0.9 µm (shown in Figure 6-12 with a
dotted line). This extrapolation demonstrates monotonically increasing flux
with decreasing D p below 0.9 µm. The Mårtensson et al. (2003)
parameterization, based on the size spectra observed in the laboratory as well
in the available field data, offers a different dependence for D p < 0.9 Pm.
Figure 6-12. Parameterization (6.22)-(6.24) of the primary aerosol production shown as a
function of the dry particle diameter D p , for a wind speed of 9 m s
-1 and water temperatures
25°C (solid bold line) and 5°C (dashed line). This parameterization is also compared with the
source flux from Monahan et al. (1986) in the size interval 0.9 –11.2 D p µm (solid line) and
extrapolated down to 0.02 µm, i.e., in the size interval 0.020–0.9 µm D p (dotted line). The
In the size range D p = 0.07–0.9 µm, Monahan et al. (1986) may
underestimate the flux, while below 0.07 µm D p , they overestimate the flux,
compared to Mårtensson et al. (2003). The deviation of the Monahan et al.
(1986) parameterization below 1 µm D p is presumably because it is based on
Chapter 6: HIGH WIND SPEED REGIME
423
flux derived by Smith et al. (1993) is shown by a dot-dashed line. Reproduced from Mårtensson
et al. (2003) by permission from American Geophysical Union.