

THE NEAR-SURFACE LAYER OF THE OCEAN
the lower salinity will evaporate to particles with smaller diameter D p . The
ratio between the diameters of dry particles resulting from 33.0 and 9.2‰
salinity following from simple considerations is determined as (33.0/9.2)
1/3 ~
1.5.
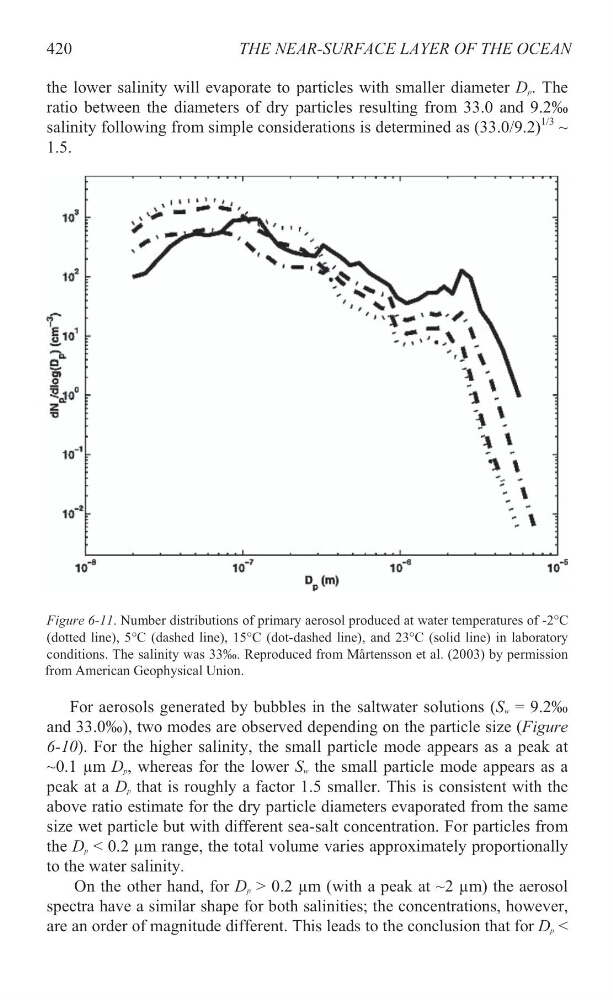
Figure 6-11. Number distributions of primary aerosol produced at water temperatures of -2°C
(dotted line), 5°C (dashed line), 15°C (dot-dashed line), and 23°C (solid line) in laboratory
For aerosols generated by bubbles in the saltwater solutions (S w = 9.2‰
and 33.0‰), two modes are observed depending on the particle size (Figure
6-10). For the higher salinity, the small particle mode appears as a peak at
~0.1 µm D p , whereas for the lower S w the small particle mode appears as a
peak at a D p that is roughly a factor 1.5 smaller. This is consistent with the
above ratio estimate for the dry particle diameters evaporated from the same
size wet particle but with different sea-salt concentration. For particles from
the D p < 0.2 µm range, the total volume varies approximately proportionally
to the water salinity.
On the other hand, for D p > 0.2 µm (with a peak at ~2 µm) the aerosol
spectra have a similar shape for both salinities; the concentrations, however,
are an order of magnitude different. This leads to the conclusion that for D p <
420
conditions. The salinity was 33‰. Reproduced from Mårtensson et al. (2003) by permission
from American Geophysical Union.
the lower salinity will evaporate to particles with smaller diameter D p . The
ratio between the diameters of dry particles resulting from 33.0 and 9.2‰
salinity following from simple considerations is determined as (33.0/9.2)
1/3 ~
1.5.
Figure 6-11. Number distributions of primary aerosol produced at water temperatures of -2°C
(dotted line), 5°C (dashed line), 15°C (dot-dashed line), and 23°C (solid line) in laboratory
For aerosols generated by bubbles in the saltwater solutions (S w = 9.2‰
and 33.0‰), two modes are observed depending on the particle size (Figure
6-10). For the higher salinity, the small particle mode appears as a peak at
~0.1 µm D p , whereas for the lower S w the small particle mode appears as a
peak at a D p that is roughly a factor 1.5 smaller. This is consistent with the
above ratio estimate for the dry particle diameters evaporated from the same
size wet particle but with different sea-salt concentration. For particles from
the D p < 0.2 µm range, the total volume varies approximately proportionally
to the water salinity.
On the other hand, for D p > 0.2 µm (with a peak at ~2 µm) the aerosol
spectra have a similar shape for both salinities; the concentrations, however,
are an order of magnitude different. This leads to the conclusion that for D p <
420
conditions. The salinity was 33‰. Reproduced from Mårtensson et al. (2003) by permission
from American Geophysical Union.