

1086 16.05
p
p
r
T
(6.4),
where p
r and p
T are the peak radius and temperature.
Table 6-2. Coefficients for equation (6.3) parameterizing clean oscillating bubbles. (After
Patro et al., 2001.)
H 1
K 1
r C
w bm
m 1
m 2
-4.792x10
-4
0.733
0.0584
22.16
-0.849
-0.815
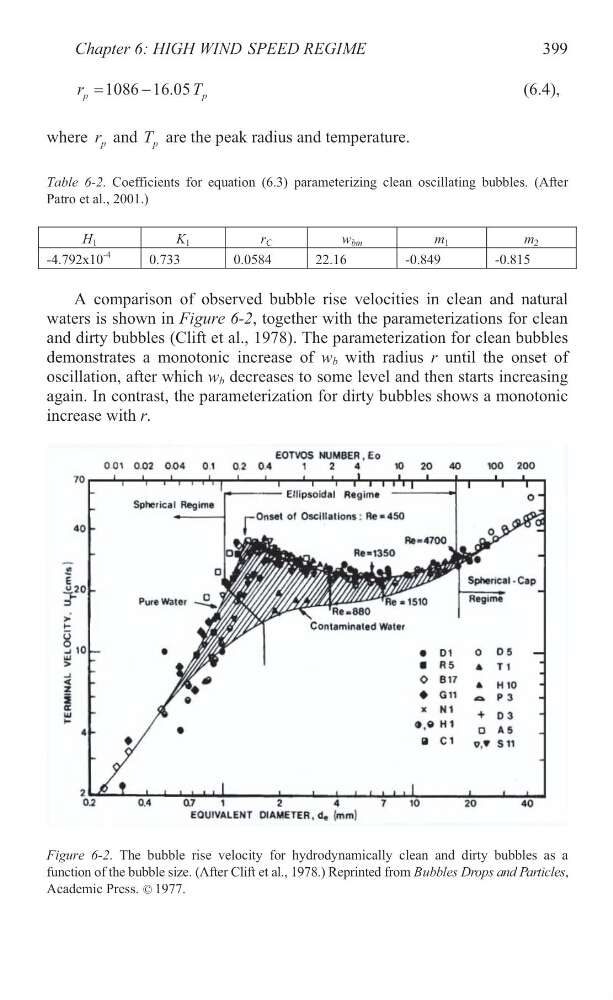
A comparison of observed bubble rise velocities in clean and natural
waters is shown in Figure 6-2, together with the parameterizations for clean
and dirty bubbles (Clift et al., 1978). The parameterization for clean bubbles
demonstrates a monotonic increase of w b with radius r until the onset of
oscillation, after which w b decreases to some level and then starts increasing
again. In contrast, the parameterization for dirty bubbles shows a monotonic
increase with r.
Figure 6-2. The bubble rise velocity for hydrodynamically clean and dirty bubbles as a
Chapter 6: HIGH WIND SPEED REGIME
399
©
Academic Press. 1977.
function of the bubble size. (After Clift et al., 1978.) Reprinted from Bubbles Drops and Particles,
p
p
r
T
(6.4),
where p
r and p
T are the peak radius and temperature.
Table 6-2. Coefficients for equation (6.3) parameterizing clean oscillating bubbles. (After
Patro et al., 2001.)
H 1
K 1
r C
w bm
m 1
m 2
-4.792x10
-4
0.733
0.0584
22.16
-0.849
-0.815
A comparison of observed bubble rise velocities in clean and natural
waters is shown in Figure 6-2, together with the parameterizations for clean
and dirty bubbles (Clift et al., 1978). The parameterization for clean bubbles
demonstrates a monotonic increase of w b with radius r until the onset of
oscillation, after which w b decreases to some level and then starts increasing
again. In contrast, the parameterization for dirty bubbles shows a monotonic
increase with r.
Figure 6-2. The bubble rise velocity for hydrodynamically clean and dirty bubbles as a
Chapter 6: HIGH WIND SPEED REGIME
399
©
Academic Press. 1977.
function of the bubble size. (After Clift et al., 1978.) Reprinted from Bubbles Drops and Particles,