

Chapter 5. SPATIALLY-COHERENT STRUCTURES
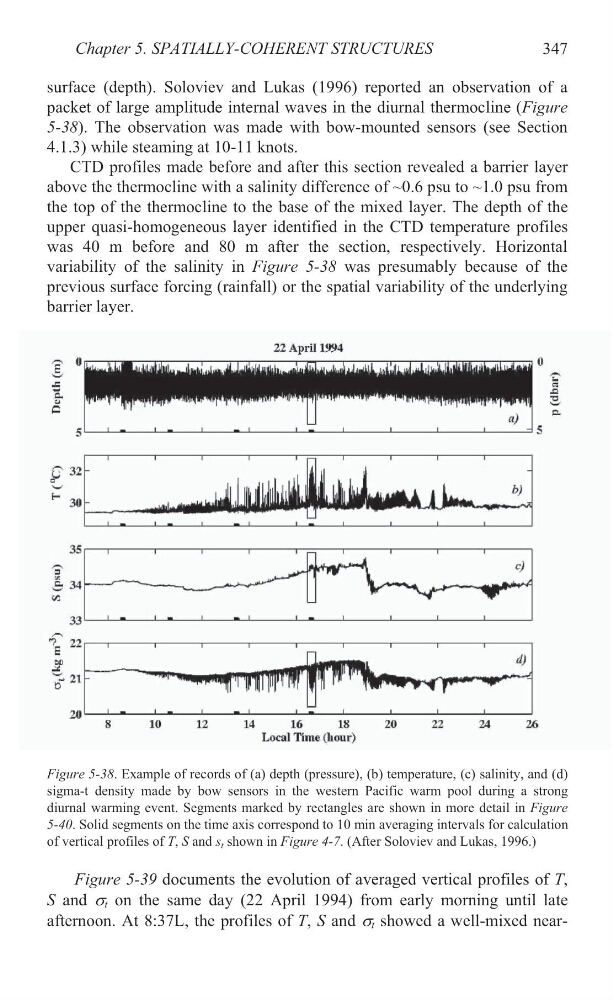
surface (depth). Soloviev and Lukas (1996) reported an observation of a
packet of large amplitude internal waves in the diurnal thermocline (Figure
5-38). The observation was made with bow-mounted sensors (see Section
4.1.3) while steaming at 10-11 knots.
CTD profiles made before and after this section revealed a barrier layer
above the thermocline with a salinity difference of ~0.6 psu to ~1.0 psu from
the top of the thermocline to the base of the mixed layer. The depth of the
upper quasi-homogeneous layer identified in the CTD temperature profiles
was 40 m before and 80 m after the section, respectively. Horizontal
variability of the salinity in Figure 5-38 was presumably because of the
previous surface forcing (rainfall) or the spatial variability of the underlying
barrier layer.
Figure 5-38. Example of records of (a) depth (pressure), (b) temperature, (c) salinity, and (d)
sigma-t density made by bow sensors in the western Pacific warm pool during a strong
diurnal warming event. Segments marked by rectangles are shown in more detail in Figure
5-40. Solid segments on the time axis correspond to 10 min averaging intervals for calculation
of vertical profiles of T, S and s t shown in Figure 4-7. (After Soloviev and Lukas, 1996.)
Figure 5-39 documents the evolution of averaged vertical profiles of T,
S and V t on the same day (22 April 1994) from early morning until late
afternoon. At 8:37L, the profiles of T, S and V t showed a well-mixed near347
surface (depth). Soloviev and Lukas (1996) reported an observation of a
packet of large amplitude internal waves in the diurnal thermocline (Figure
5-38). The observation was made with bow-mounted sensors (see Section
4.1.3) while steaming at 10-11 knots.
CTD profiles made before and after this section revealed a barrier layer
above the thermocline with a salinity difference of ~0.6 psu to ~1.0 psu from
the top of the thermocline to the base of the mixed layer. The depth of the
upper quasi-homogeneous layer identified in the CTD temperature profiles
was 40 m before and 80 m after the section, respectively. Horizontal
variability of the salinity in Figure 5-38 was presumably because of the
previous surface forcing (rainfall) or the spatial variability of the underlying
barrier layer.
Figure 5-38. Example of records of (a) depth (pressure), (b) temperature, (c) salinity, and (d)
sigma-t density made by bow sensors in the western Pacific warm pool during a strong
diurnal warming event. Segments marked by rectangles are shown in more detail in Figure
5-40. Solid segments on the time axis correspond to 10 min averaging intervals for calculation
of vertical profiles of T, S and s t shown in Figure 4-7. (After Soloviev and Lukas, 1996.)
Figure 5-39 documents the evolution of averaged vertical profiles of T,
S and V t on the same day (22 April 1994) from early morning until late
afternoon. At 8:37L, the profiles of T, S and V t showed a well-mixed near347