

Chapter 5. SPATIALLY-COHERENT STRUCTURES
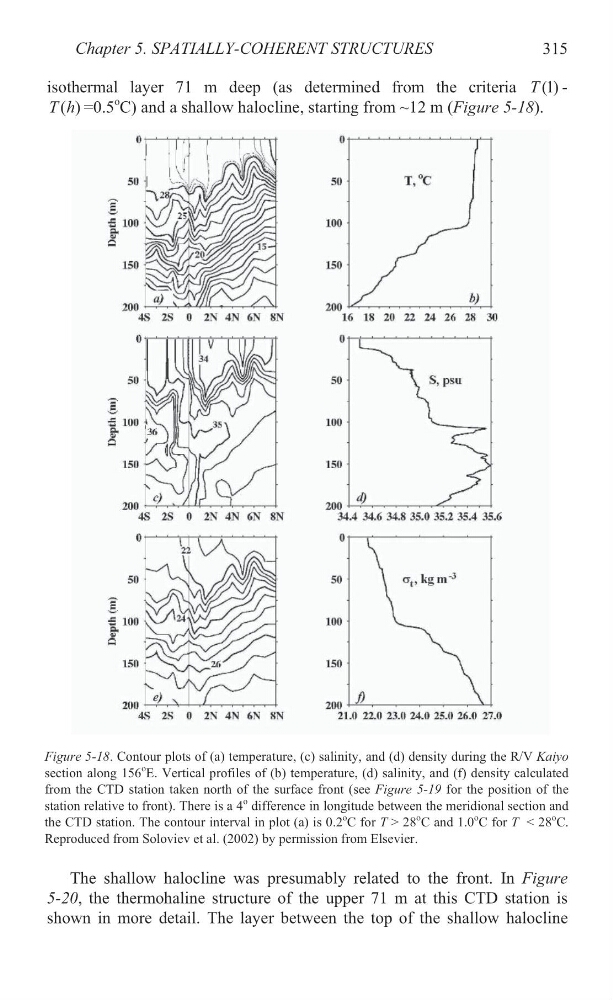
isothermal layer 71 m deep (as determined from the criteria (1)
T -
( )
T h =0.5
o C) and a shallow halocline, starting from ~12 m (Figure 5-18).
The shallow halocline was presumably related to the front. In Figure
5-20, the thermohaline structure of the upper 71 m at this CTD station is
shown in more detail. The layer between the top of the shallow halocline
315
Figure 5-18. Contour plots of (a) temperature, (c) salinity, and (d) density during the R/V Kaiyo
section along 156
o E. Vertical profiles of (b) temperature, (d) salinity, and (f) density calculated
from the CTD station taken north of the surface front (see Figure 5-19 for the position of the
station relative to front). There is a 4
o difference in longitude between the meridional section and
the CTD station. The contour interval in plot (a) is 0.2
o C for T > 28
o C and 1.0
o C for T < 28
o C.
Reproduced from Soloviev et al. (2002) by permission from Elsevier.
isothermal layer 71 m deep (as determined from the criteria (1)
T -
( )
T h =0.5
o C) and a shallow halocline, starting from ~12 m (Figure 5-18).
The shallow halocline was presumably related to the front. In Figure
5-20, the thermohaline structure of the upper 71 m at this CTD station is
shown in more detail. The layer between the top of the shallow halocline
315
Figure 5-18. Contour plots of (a) temperature, (c) salinity, and (d) density during the R/V Kaiyo
section along 156
o E. Vertical profiles of (b) temperature, (d) salinity, and (f) density calculated
from the CTD station taken north of the surface front (see Figure 5-19 for the position of the
station relative to front). There is a 4
o difference in longitude between the meridional section and
the CTD station. The contour interval in plot (a) is 0.2
o C for T > 28
o C and 1.0
o C for T < 28
o C.
Reproduced from Soloviev et al. (2002) by permission from Elsevier.