

THE NEAR-SURFACE LAYER OF THE OCEAN
Integrating the density anomaly spectrum over all directions, as in (5.13),
results in a
3
x
k
spectral law, which is consistent with experimental data
shown in Figure 5-8.
The second numerical experiment used a random initial condition in the
form of white noise. Results of this experiment are shown in Figure 5-14. In
this case the initial white spectrum also evolves into a k
-4 dependence (which
corresponds to a k x
-3 spectrum after integrating over all directions).
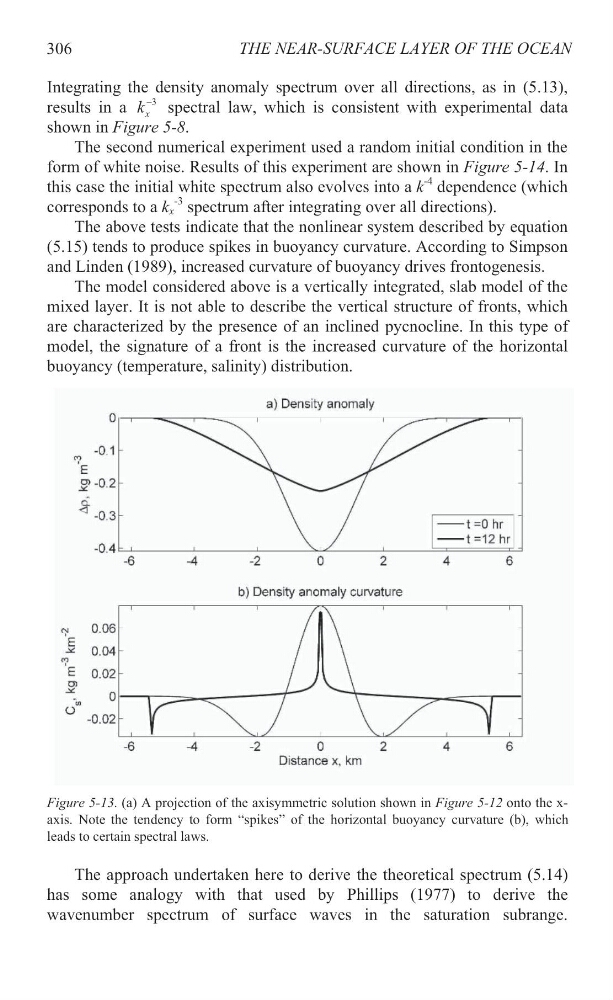
The above tests indicate that the nonlinear system described by equation
(5.15) tends to produce spikes in buoyancy curvature. According to Simpson
and Linden (1989), increased curvature of buoyancy drives frontogenesis.
The model considered above is a vertically integrated, slab model of the
mixed layer. It is not able to describe the vertical structure of fronts, which
are characterized by the presence of an inclined pycnocline. In this type of
model, the signature of a front is the increased curvature of the horizontal
buoyancy (temperature, salinity) distribution.
Figure 5-13. (a) A projection of the axisymmetric solution shown in Figure 5-12 onto the xaxis. Note the tendency to form “spikes” of the horizontal buoyancy curvature (b), which
leads to certain spectral laws.
The approach undertaken here to derive the theoretical spectrum (5.14)
has some analogy with that used by Phillips (1977) to derive the
wavenumber spectrum of surface waves in the saturation subrange.
306
Integrating the density anomaly spectrum over all directions, as in (5.13),
results in a
3
x
k
spectral law, which is consistent with experimental data
shown in Figure 5-8.
The second numerical experiment used a random initial condition in the
form of white noise. Results of this experiment are shown in Figure 5-14. In
this case the initial white spectrum also evolves into a k
-4 dependence (which
corresponds to a k x
-3 spectrum after integrating over all directions).
The above tests indicate that the nonlinear system described by equation
(5.15) tends to produce spikes in buoyancy curvature. According to Simpson
and Linden (1989), increased curvature of buoyancy drives frontogenesis.
The model considered above is a vertically integrated, slab model of the
mixed layer. It is not able to describe the vertical structure of fronts, which
are characterized by the presence of an inclined pycnocline. In this type of
model, the signature of a front is the increased curvature of the horizontal
buoyancy (temperature, salinity) distribution.
Figure 5-13. (a) A projection of the axisymmetric solution shown in Figure 5-12 onto the xaxis. Note the tendency to form “spikes” of the horizontal buoyancy curvature (b), which
leads to certain spectral laws.
The approach undertaken here to derive the theoretical spectrum (5.14)
has some analogy with that used by Phillips (1977) to derive the
wavenumber spectrum of surface waves in the saturation subrange.
306