

THE NEAR-SURFACE LAYER OF THE OCEAN
salinity expansion, r
T is the raindrop temperature, and 0
T is the sea surface
temperature. The term in brackets on the right side of equation (5.10) is the
buoyancy flux due to air-sea heat fluxes (I R is the insolation, I L is the
effective longwave radiation, Q E and Q T are is the latent and sensible heat
fluxes, respectively). The second term is the buoyancy flux due to the
surface salinity change because of evaporation and rain. The third term is the
buoyancy flux due to the heat flux because of the difference between the
raindrops and seawater temperature. Here we ignore the volume nature of
the rain induced buoyancy flux.
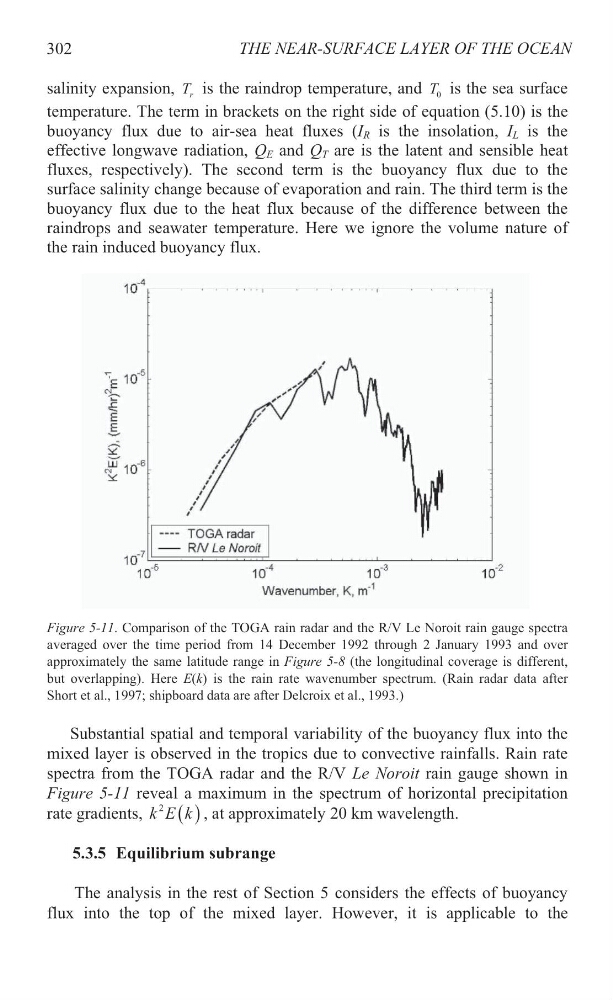
Figure 5-11. Comparison of the TOGA rain radar and the R/V Le Noroit rain gauge spectra
averaged over the time period from 14 December 1992 through 2 January 1993 and over
approximately the same latitude range in Figure 5-8 (the longitudinal coverage is different,
but overlapping). Here E(k) is the rain rate wavenumber spectrum. (Rain radar data after
Short et al., 1997; shipboard data are after Delcroix et al., 1993.)
Substantial spatial and temporal variability of the buoyancy flux into the
mixed layer is observed in the tropics due to convective rainfalls. Rain rate
spectra from the TOGA radar and the R/V Le Noroit rain gauge shown in
Figure 5-11 reveal a maximum in the spectrum of horizontal precipitation
rate gradients,
2
k E k , at approximately 20 km wavelength.
5.3.5 Equilibrium subrange
The analysis in the rest of Section 5 considers the effects of buoyancy
flux into the top of the mixed layer. However, it is applicable to the
302
salinity expansion, r
T is the raindrop temperature, and 0
T is the sea surface
temperature. The term in brackets on the right side of equation (5.10) is the
buoyancy flux due to air-sea heat fluxes (I R is the insolation, I L is the
effective longwave radiation, Q E and Q T are is the latent and sensible heat
fluxes, respectively). The second term is the buoyancy flux due to the
surface salinity change because of evaporation and rain. The third term is the
buoyancy flux due to the heat flux because of the difference between the
raindrops and seawater temperature. Here we ignore the volume nature of
the rain induced buoyancy flux.
Figure 5-11. Comparison of the TOGA rain radar and the R/V Le Noroit rain gauge spectra
averaged over the time period from 14 December 1992 through 2 January 1993 and over
approximately the same latitude range in Figure 5-8 (the longitudinal coverage is different,
but overlapping). Here E(k) is the rain rate wavenumber spectrum. (Rain radar data after
Short et al., 1997; shipboard data are after Delcroix et al., 1993.)
Substantial spatial and temporal variability of the buoyancy flux into the
mixed layer is observed in the tropics due to convective rainfalls. Rain rate
spectra from the TOGA radar and the R/V Le Noroit rain gauge shown in
Figure 5-11 reveal a maximum in the spectrum of horizontal precipitation
rate gradients,
2
k E k , at approximately 20 km wavelength.
5.3.5 Equilibrium subrange
The analysis in the rest of Section 5 considers the effects of buoyancy
flux into the top of the mixed layer. However, it is applicable to the
302