

THE NEAR-SURFACE LAYER OF THE OCEAN
Both the ship’s pitching and surface waves induce fluctuations of angle
between the flow direction and the probe’s longitudinal axis. At sufficiently
large angles, the 40 mm diameter tip of the EM probe containing sensing
electrodes may start shedding vortices, which are the source of additional
hydrodynamic noise. In the example shown in Figure 3-9a, the ship speed U 0
= 5.9 m s
-1 ; disturbances with 40 mm wavelength translates into a frequency
f = 140 Hz. There are several, relatively small but persistent spectral peaks
observed in the velocity spectrum at f > 140 Hz (Figure 3-9a). These peaks
are not observed in the noise spectrum taken in the laboratory (motionless
water) and are supposedly due to the hydrodynamic noise of the sensor. The
signal in the frequency range from 4 Hz to 16 Hz (that we use here for
dissipation rate estimates) is not affected by the hydrodynamic noise.
172
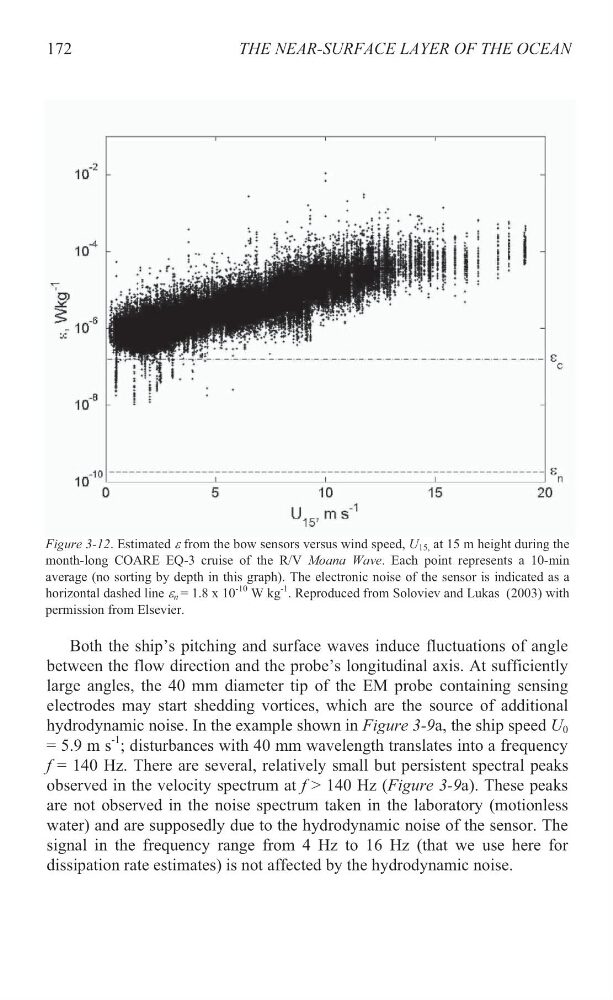
Figure 3-12. Estimated H from the bow sensors versus wind speed, U 15, at 15 m height during the
month-long COARE EQ-3 cruise of the R/V Moana Wave. Each point represents a 10-min
average (no sorting by depth in this graph). The electronic noise of the sensor is indicated as a
horizontal dashed line H n = 1.8 x 10
-10 W kg
-1 . Reproduced from Soloviev and Lukas (2003) with
permission from Elsevier.
Both the ship’s pitching and surface waves induce fluctuations of angle
between the flow direction and the probe’s longitudinal axis. At sufficiently
large angles, the 40 mm diameter tip of the EM probe containing sensing
electrodes may start shedding vortices, which are the source of additional
hydrodynamic noise. In the example shown in Figure 3-9a, the ship speed U 0
= 5.9 m s
-1 ; disturbances with 40 mm wavelength translates into a frequency
f = 140 Hz. There are several, relatively small but persistent spectral peaks
observed in the velocity spectrum at f > 140 Hz (Figure 3-9a). These peaks
are not observed in the noise spectrum taken in the laboratory (motionless
water) and are supposedly due to the hydrodynamic noise of the sensor. The
signal in the frequency range from 4 Hz to 16 Hz (that we use here for
dissipation rate estimates) is not affected by the hydrodynamic noise.
172
Figure 3-12. Estimated H from the bow sensors versus wind speed, U 15, at 15 m height during the
month-long COARE EQ-3 cruise of the R/V Moana Wave. Each point represents a 10-min
average (no sorting by depth in this graph). The electronic noise of the sensor is indicated as a
horizontal dashed line H n = 1.8 x 10
-10 W kg
-1 . Reproduced from Soloviev and Lukas (2003) with
permission from Elsevier.