

THE NEAR-SURFACE LAYER OF THE OCEAN
Ship pitching and surface waves (including those reflected from the ship’s
hull) induce fluctuations in the mean flow at the sensor location. A strong
velocity fluctuation may result in flow reversal, which affects the turbulence
measurements. Though the problem of flow reversals during measurements
with bow-mounted sensors is not that severe as in the case of mooring or
tower-based systems, it may increase the noise level of measurements under
low ship speeds and/or large waves. To identify such cases, Soloviev et al.
(1999) analyzed the sum 0
x
U V
, where U 0 is the ship speed, and x
V is the
longitudinal component of the bow velocity signal. (For the analysis of
small-scale processes in this chapter we assume that the sensor moves in the
x-direction.) Negative values of 0
x
U V
are flow reversals; these recorded
segments are removed from further analysis. Flow reversals were found
mainly at low ship speeds (U 0 < 2 m s
-1 ). Most of the data were taken at
|
0
U
5 m s
-1 ; the cases with U 0 < 2 m s
-1 have been removed from the
analysis.
Due to surface waves and the ship pitching, the instantaneous depth of the
sensors (defined here as the distance to the ocean surface) was continuously
changing. The pressure signal was used to estimate the distance of the sensor
to the ocean surface. To reduce dynamic pressure effects, the pressure sensor
162
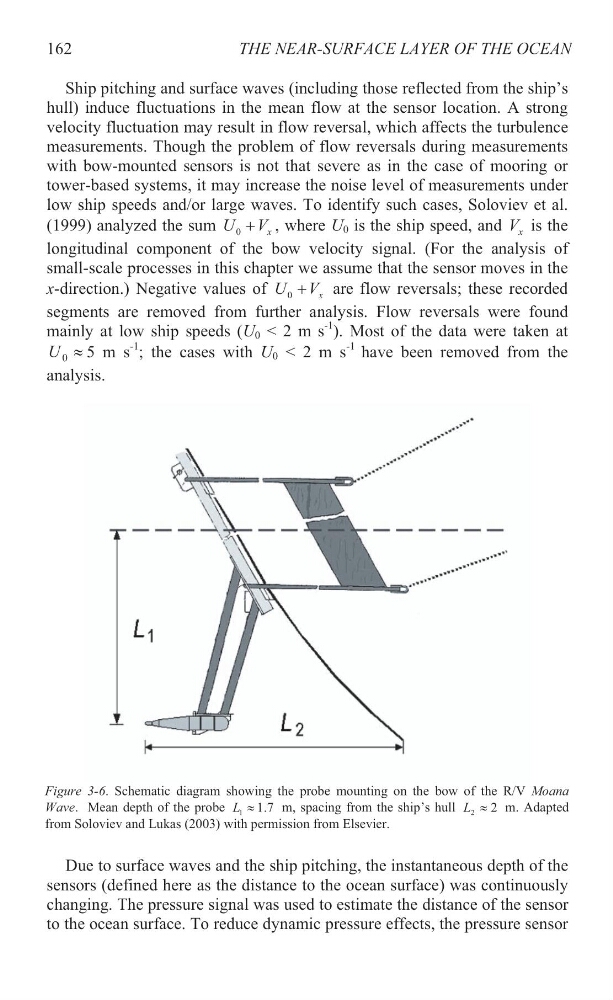
Figure 3-6. Schematic diagram showing the probe mounting on the bow of the R/V Moana
Wave. Mean depth of the probe
7
.
1
1 |
L
m, spacing from the ship’s hull
2
2 |
L
m. Adapted
from Soloviev and Lukas (2003) with permission from Elsevier.
Ship pitching and surface waves (including those reflected from the ship’s
hull) induce fluctuations in the mean flow at the sensor location. A strong
velocity fluctuation may result in flow reversal, which affects the turbulence
measurements. Though the problem of flow reversals during measurements
with bow-mounted sensors is not that severe as in the case of mooring or
tower-based systems, it may increase the noise level of measurements under
low ship speeds and/or large waves. To identify such cases, Soloviev et al.
(1999) analyzed the sum 0
x
U V
, where U 0 is the ship speed, and x
V is the
longitudinal component of the bow velocity signal. (For the analysis of
small-scale processes in this chapter we assume that the sensor moves in the
x-direction.) Negative values of 0
x
U V
are flow reversals; these recorded
segments are removed from further analysis. Flow reversals were found
mainly at low ship speeds (U 0 < 2 m s
-1 ). Most of the data were taken at
|
0
U
5 m s
-1 ; the cases with U 0 < 2 m s
-1 have been removed from the
analysis.
Due to surface waves and the ship pitching, the instantaneous depth of the
sensors (defined here as the distance to the ocean surface) was continuously
changing. The pressure signal was used to estimate the distance of the sensor
to the ocean surface. To reduce dynamic pressure effects, the pressure sensor
162
Figure 3-6. Schematic diagram showing the probe mounting on the bow of the R/V Moana
Wave. Mean depth of the probe
7
.
1
1 |
L
m, spacing from the ship’s hull
2
2 |
L
m. Adapted
from Soloviev and Lukas (2003) with permission from Elsevier.