

Chapter 2: SEA SURFACE MICROLAYER
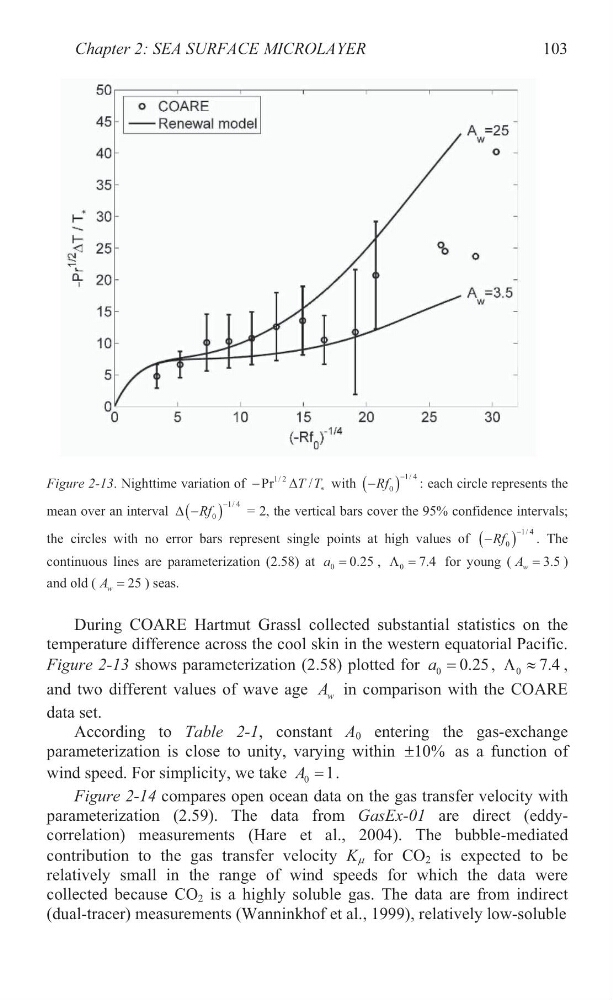
Figure 2-13. Nighttime variation of
1/ 2
Pr
/
T T
'
with
1/ 4
0
Rf
: each circle represents the
mean over an interval
1/ 4
0
Rf
'
= 2, the vertical bars cover the 95% confidence intervals;
the circles with no error bars represent single points at high values of
1/ 4
0
Rf
. The
continuous lines are parameterization (2.58) at 0 0.25
a
, 0 7.4
/
for young (
3.5
w
A
)
and old (
25
w
A
) seas.
During COARE Hartmut Grassl collected substantial statistics on the
temperature difference across the cool skin in the western equatorial Pacific.
Figure 2-13 shows parameterization (2.58) plotted for 0 0.25
a
, 0 7.4
/ |
,
and two different values of wave age w
A in comparison with the COARE
data set.
According to Table 2-1, constant A 0 entering the gas-exchange
parameterization is close to unity, varying within 10%
r
as a function of
wind speed. For simplicity, we take 0 1
A
.
Figure 2-14 compares open ocean data on the gas transfer velocity with
parameterization (2.59). The data from GasEx-01 are direct (eddycorrelation) measurements (Hare et al., 2004). The bubble-mediated
contribution to the gas transfer velocity K P for CO 2 is expected to be
relatively small in the range of wind speeds for which the data were
collected because CO 2 is a highly soluble gas. The data are from indirect
(dual-tracer) measurements (Wanninkhof et al., 1999), relatively low-soluble
103
Figure 2-13. Nighttime variation of
1/ 2
Pr
/
T T
'
with
1/ 4
0
Rf
: each circle represents the
mean over an interval
1/ 4
0
Rf
'
= 2, the vertical bars cover the 95% confidence intervals;
the circles with no error bars represent single points at high values of
1/ 4
0
Rf
. The
continuous lines are parameterization (2.58) at 0 0.25
a
, 0 7.4
/
for young (
3.5
w
A
)
and old (
25
w
A
) seas.
During COARE Hartmut Grassl collected substantial statistics on the
temperature difference across the cool skin in the western equatorial Pacific.
Figure 2-13 shows parameterization (2.58) plotted for 0 0.25
a
, 0 7.4
/ |
,
and two different values of wave age w
A in comparison with the COARE
data set.
According to Table 2-1, constant A 0 entering the gas-exchange
parameterization is close to unity, varying within 10%
r
as a function of
wind speed. For simplicity, we take 0 1
A
.
Figure 2-14 compares open ocean data on the gas transfer velocity with
parameterization (2.59). The data from GasEx-01 are direct (eddycorrelation) measurements (Hare et al., 2004). The bubble-mediated
contribution to the gas transfer velocity K P for CO 2 is expected to be
relatively small in the range of wind speeds for which the data were
collected because CO 2 is a highly soluble gas. The data are from indirect
(dual-tracer) measurements (Wanninkhof et al., 1999), relatively low-soluble
103