

22
DYNAMICAL OCEANOGRAPHY
Summary
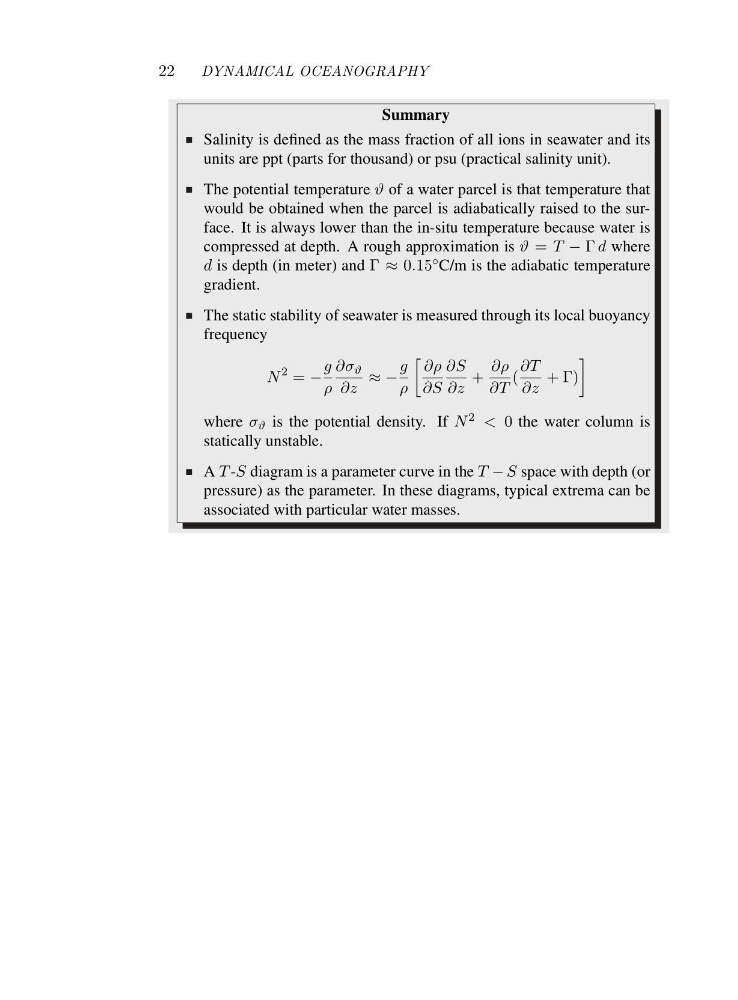
Salinity is defined as the mass fraction of all ions in seawater and its
units are ppt (parts for thousand) or psu (practical salinity unit).
The potential temperature ϑ of a water parcel is that temperature that
would be obtained when the parcel is adiabatically raised to the surface. It is always lower than the in-situ temperature because water is
compressed at depth. A rough approximation is ϑ = T − Γ d where
d is depth (in meter) and Γ ≈ 0.15 ◦ C/m is the adiabatic temperature
gradient.
The static stability of seawater is measured through its local buoyancy
frequency
N
2 = −
g
ρ
∂σ ϑ
∂z
≈−
g
ρ
∂ρ
∂S
∂S
∂z
+
∂ρ
∂T
(
∂T
∂z
+Γ)
where σ ϑ is the potential density. If N 2 < 0 the water column is
statically unstable.
A T -S diagram is a parameter curve in the T − S space with depth (or
pressure) as the parameter. In these diagrams, typical extrema can be
associated with particular water masses.
DYNAMICAL OCEANOGRAPHY
Summary
Salinity is defined as the mass fraction of all ions in seawater and its
units are ppt (parts for thousand) or psu (practical salinity unit).
The potential temperature ϑ of a water parcel is that temperature that
would be obtained when the parcel is adiabatically raised to the surface. It is always lower than the in-situ temperature because water is
compressed at depth. A rough approximation is ϑ = T − Γ d where
d is depth (in meter) and Γ ≈ 0.15 ◦ C/m is the adiabatic temperature
gradient.
The static stability of seawater is measured through its local buoyancy
frequency
N
2 = −
g
ρ
∂σ ϑ
∂z
≈−
g
ρ
∂ρ
∂S
∂S
∂z
+
∂ρ
∂T
(
∂T
∂z
+Γ)
where σ ϑ is the potential density. If N 2 < 0 the water column is
statically unstable.
A T -S diagram is a parameter curve in the T − S space with depth (or
pressure) as the parameter. In these diagrams, typical extrema can be
associated with particular water masses.