

Equatorial ocean circulation
245
Figure 11.4. Annual mean SST in the Tropical Oceans (Levitus and Boyer, 1994).
only over the last decade, the temperature at these depths have been measured routinely through the TAO-buoy network (see http://www.pmel.noaa.gov/toga-tao).
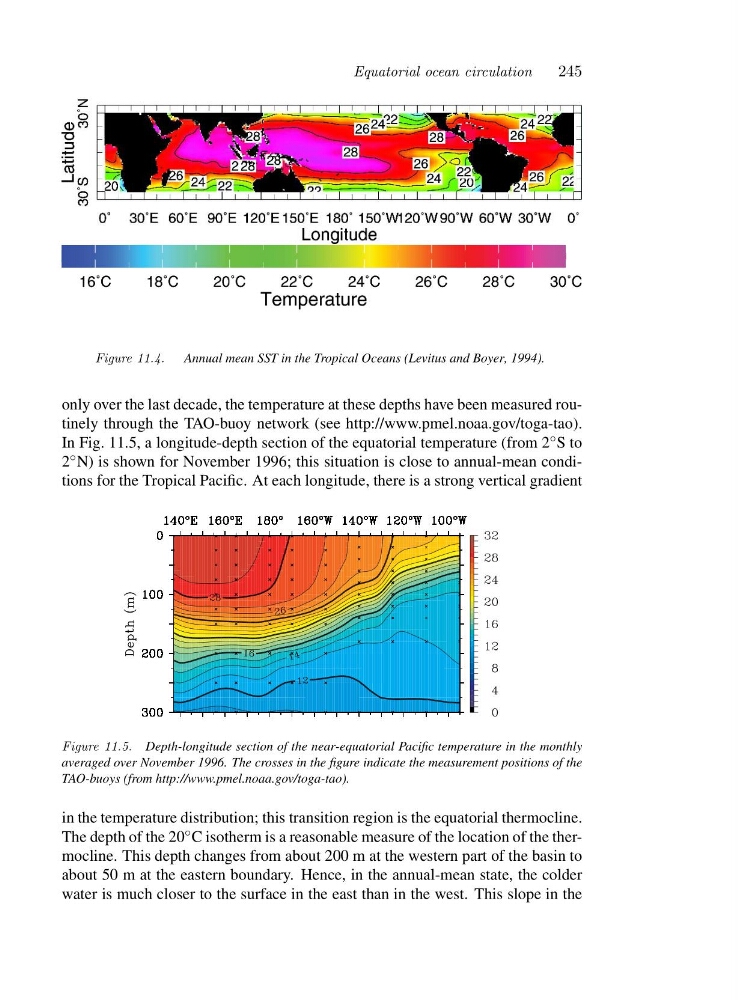
In Fig. 11.5, a longitude-depth section of the equatorial temperature (from 2 ◦ Sto
2 ◦ N) is shown for November 1996; this situation is close to annual-mean conditions for the Tropical Pacific. At each longitude, there is a strong vertical gradient
Figure 11.5. Depth-longitude section of the near-equatorial Pacific temperature in the monthly
averaged over November 1996. The crosses in the figure indicate the measurement positions of the
TAO-buoys (from http://www.pmel.noaa.gov/toga-tao).
in the temperature distribution; this transition region is the equatorial thermocline.
The depth of the 20 ◦ C isotherm is a reasonable measure of the location of the thermocline. This depth changes from about 200 m at the western part of the basin to
about 50 m at the eastern boundary. Hence, in the annual-mean state, the colder
water is much closer to the surface in the east than in the west. This slope in the
245
Figure 11.4. Annual mean SST in the Tropical Oceans (Levitus and Boyer, 1994).
only over the last decade, the temperature at these depths have been measured routinely through the TAO-buoy network (see http://www.pmel.noaa.gov/toga-tao).
In Fig. 11.5, a longitude-depth section of the equatorial temperature (from 2 ◦ Sto
2 ◦ N) is shown for November 1996; this situation is close to annual-mean conditions for the Tropical Pacific. At each longitude, there is a strong vertical gradient
Figure 11.5. Depth-longitude section of the near-equatorial Pacific temperature in the monthly
averaged over November 1996. The crosses in the figure indicate the measurement positions of the
TAO-buoys (from http://www.pmel.noaa.gov/toga-tao).
in the temperature distribution; this transition region is the equatorial thermocline.
The depth of the 20 ◦ C isotherm is a reasonable measure of the location of the thermocline. This depth changes from about 200 m at the western part of the basin to
about 50 m at the eastern boundary. Hence, in the annual-mean state, the colder
water is much closer to the surface in the east than in the west. This slope in the