

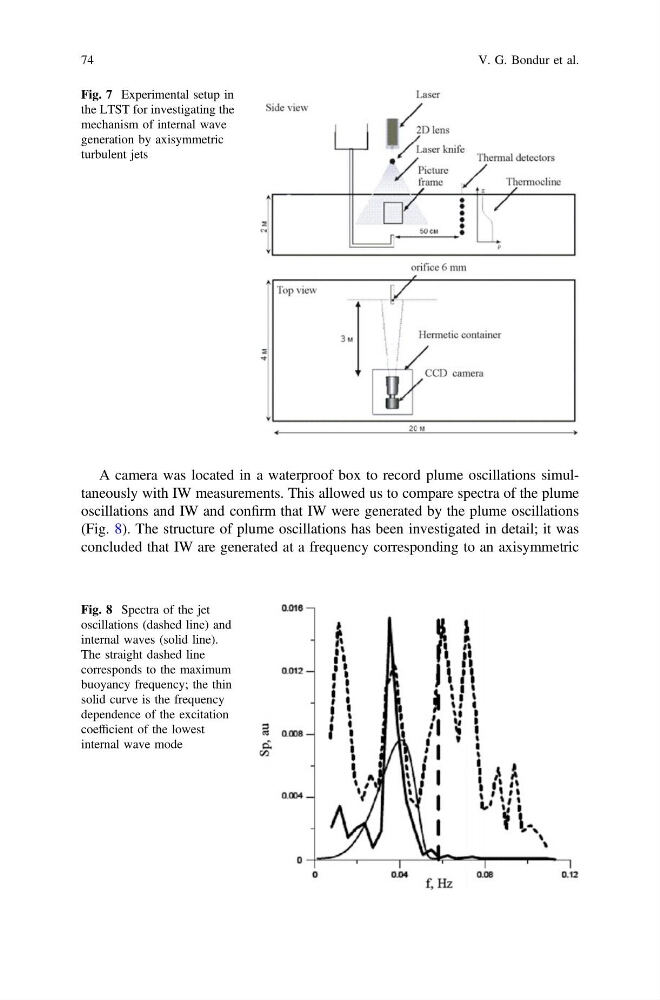
A camera was located in a waterproof box to record plume oscillations simultaneously with IW measurements. This allowed us to compare spectra of the plume
oscillations and IW and confirm that IW were generated by the plume oscillations
(Fig. 8). The structure of plume oscillations has been investigated in detail; it was
concluded that IW are generated at a frequency corresponding to an axisymmetric
Fig. 7 Experimental setup in
the LTST for investigating the
mechanism of internal wave
generation by axisymmetric
turbulent jets
Fig. 8 Spectra of the jet
oscillations (dashed line) and
internal waves (solid line).
The straight dashed line
corresponds to the maximum
buoyancy frequency; the thin
solid curve is the frequency
dependence of the excitation
coefficient of the lowest
internal wave mode
74
V. G. Bondur et al.
oscillations and IW and confirm that IW were generated by the plume oscillations
(Fig. 8). The structure of plume oscillations has been investigated in detail; it was
concluded that IW are generated at a frequency corresponding to an axisymmetric
Fig. 7 Experimental setup in
the LTST for investigating the
mechanism of internal wave
generation by axisymmetric
turbulent jets
Fig. 8 Spectra of the jet
oscillations (dashed line) and
internal waves (solid line).
The straight dashed line
corresponds to the maximum
buoyancy frequency; the thin
solid curve is the frequency
dependence of the excitation
coefficient of the lowest
internal wave mode
74
V. G. Bondur et al.