

The spatial variation of the Froude number along the study section is shown in
Fig. 9 together with the other characteristic quantities: linear phase speed of IWs
and maximal tidal velocity in the study site. The zone of Fr > 1 is located between
points at 225 and 237 km. The most intense IWs appeared in the numerical runs
exactly within this interval.
It is interesting to note that such a complex fully nonlinear process of the
barotropic tide interaction with the bottom topography generates almost symmetric
(from the point of view of horizontal direction) field of total (barotropic and
baroclinic) near-bottom velocity (see Fig. 10), because the supercritical zones are
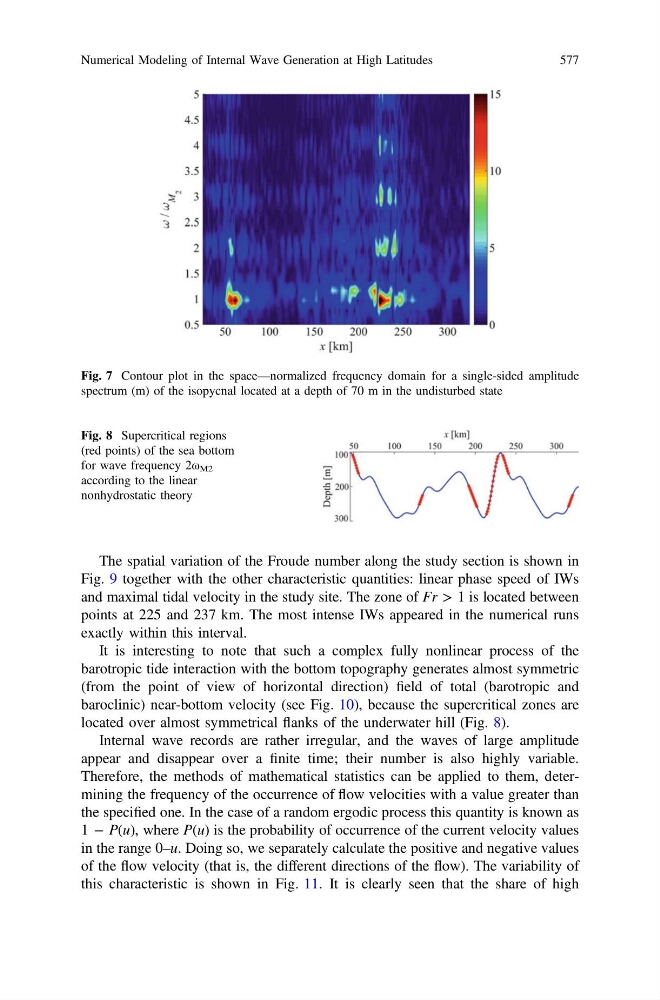
located over almost symmetrical flanks of the underwater hill (Fig. 8).
Internal wave records are rather irregular, and the waves of large amplitude
appear and disappear over a finite time; their number is also highly variable.
Therefore, the methods of mathematical statistics can be applied to them, determining the frequency of the occurrence of flow velocities with a value greater than
the specified one. In the case of a random ergodic process this quantity is known as
1 − P(u), where P(u) is the probability of occurrence of the current velocity values
in the range 0–u. Doing so, we separately calculate the positive and negative values
of the flow velocity (that is, the different directions of the flow). The variability of
this characteristic is shown in Fig. 11. It is clearly seen that the share of high
Fig. 7 Contour plot in the space—normalized frequency domain for a single-sided amplitude
spectrum (m) of the isopycnal located at a depth of 70 m in the undisturbed state
Fig. 8 Supercritical regions
(red points) of the sea bottom
for wave frequency 2ω M2
according to the linear
nonhydrostatic theory
Numerical Modeling of Internal Wave Generation at High Latitudes
577