

associated with the direction to the north, positive direction of the x-axis is associated with the direction to the east, and polar angle θ increases in the clockwise
direction.
Elastic-plastic model of the ice cover is considered. The yield surface (YC) is
specified by the equation
f Y ðσ I , σ II , hÞ = 0,
ð3Þ
where 2σ I = σ 1 + σ 2 , 2σ II = σ 1 − σ 2 , σ 1 , and σ 2 are the maximal and minimal
principal stresses, − σ I is the pressure, and σ II is the maximal shear stress.
Normal flow rule is satisfied when the stresses belong to the YC:
e I = λ
∂f Y
∂σ I
, e II = λ
∂f Y
∂σ II
, λ ≥ 0,
ð4Þ
where e I = e 1 + e 2 , e II = e 1 − e 2 , and e 1 and e 2 are the maximal and minimal principal strain rates.
The YC shown in Fig. 6 has a shape of the closed curve located in the region of
positive pressure (σ I < 0). The YC is characterized by two rheological constants (P
*
and γ). It is described by the following formula [7]:
γσ
2
II = σ
2
I 1 +
σ I
P * h
, P
* = 5 kPa, γ = 3,
ð5Þ
Point O s with horizontal tangent line has coordinates σ I ̸ h = − 2P
*
̸ 3 and
σ II ̸ h = − 2P
*
̸ ð3
ffiffiffiffiffi
3γ
p Þ (Fig. 6). According to the normal flow rule (4), plastic
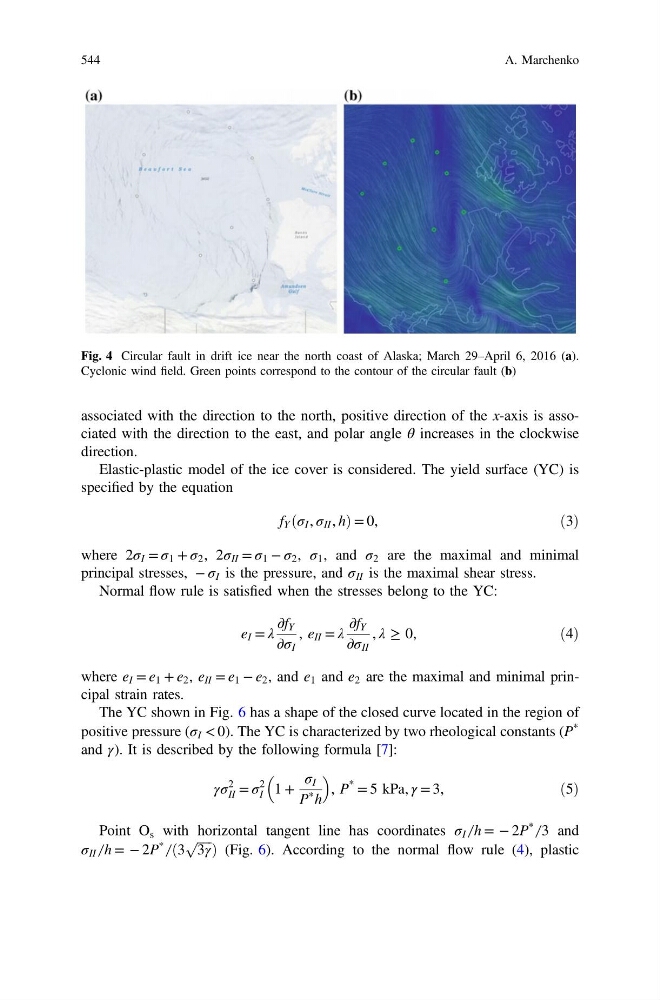
Fig. 4 Circular fault in drift ice near the north coast of Alaska; March 29–April 6, 2016 (a).
Cyclonic wind field. Green points correspond to the contour of the circular fault (b)
544
A. Marchenko
direction.
Elastic-plastic model of the ice cover is considered. The yield surface (YC) is
specified by the equation
f Y ðσ I , σ II , hÞ = 0,
ð3Þ
where 2σ I = σ 1 + σ 2 , 2σ II = σ 1 − σ 2 , σ 1 , and σ 2 are the maximal and minimal
principal stresses, − σ I is the pressure, and σ II is the maximal shear stress.
Normal flow rule is satisfied when the stresses belong to the YC:
e I = λ
∂f Y
∂σ I
, e II = λ
∂f Y
∂σ II
, λ ≥ 0,
ð4Þ
where e I = e 1 + e 2 , e II = e 1 − e 2 , and e 1 and e 2 are the maximal and minimal principal strain rates.
The YC shown in Fig. 6 has a shape of the closed curve located in the region of
positive pressure (σ I < 0). The YC is characterized by two rheological constants (P
*
and γ). It is described by the following formula [7]:
γσ
2
II = σ
2
I 1 +
σ I
P * h
, P
* = 5 kPa, γ = 3,
ð5Þ
Point O s with horizontal tangent line has coordinates σ I ̸ h = − 2P
*
̸ 3 and
σ II ̸ h = − 2P
*
̸ ð3
ffiffiffiffiffi
3γ
p Þ (Fig. 6). According to the normal flow rule (4), plastic
Fig. 4 Circular fault in drift ice near the north coast of Alaska; March 29–April 6, 2016 (a).
Cyclonic wind field. Green points correspond to the contour of the circular fault (b)
544
A. Marchenko