

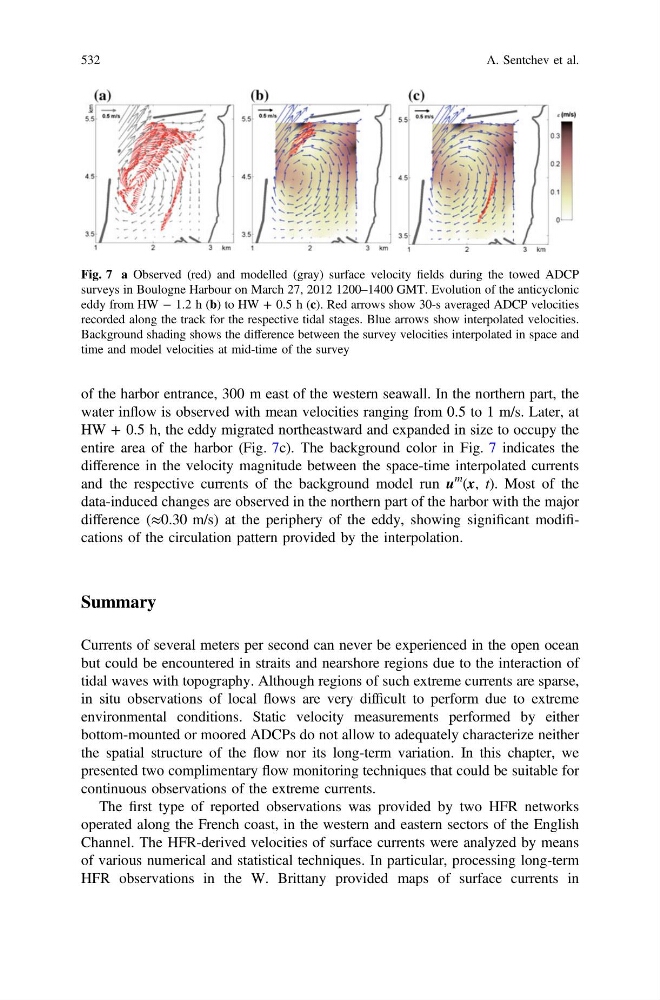
of the harbor entrance, 300 m east of the western seawall. In the northern part, the
water inflow is observed with mean velocities ranging from 0.5 to 1 m/s. Later, at
HW + 0.5 h, the eddy migrated northeastward and expanded in size to occupy the
entire area of the harbor (Fig. 7c). The background color in Fig. 7 indicates the
difference in the velocity magnitude between the space-time interpolated currents
and the respective currents of the background model run u
m (x, t). Most of the
data-induced changes are observed in the northern part of the harbor with the major
difference (≈0.30 m/s) at the periphery of the eddy, showing significant modifications of the circulation pattern provided by the interpolation.
Summary
Currents of several meters per second can never be experienced in the open ocean
but could be encountered in straits and nearshore regions due to the interaction of
tidal waves with topography. Although regions of such extreme currents are sparse,
in situ observations of local flows are very difficult to perform due to extreme
environmental conditions. Static velocity measurements performed by either
bottom-mounted or moored ADCPs do not allow to adequately characterize neither
the spatial structure of the flow nor its long-term variation. In this chapter, we
presented two complimentary flow monitoring techniques that could be suitable for
continuous observations of the extreme currents.
The first type of reported observations was provided by two HFR networks
operated along the French coast, in the western and eastern sectors of the English
Channel. The HFR-derived velocities of surface currents were analyzed by means
of various numerical and statistical techniques. In particular, processing long-term
HFR observations in the W. Brittany provided maps of surface currents in
Fig. 7 a Observed (red) and modelled (gray) surface velocity fields during the towed ADCP
surveys in Boulogne Harbour on March 27, 2012 1200–1400 GMT. Evolution of the anticyclonic
eddy from HW − 1.2 h (b) to HW + 0.5 h (c). Red arrows show 30-s averaged ADCP velocities
recorded along the track for the respective tidal stages. Blue arrows show interpolated velocities.
Background shading shows the difference between the survey velocities interpolated in space and
time and model velocities at mid-time of the survey
532
A. Sentchev et al.
water inflow is observed with mean velocities ranging from 0.5 to 1 m/s. Later, at
HW + 0.5 h, the eddy migrated northeastward and expanded in size to occupy the
entire area of the harbor (Fig. 7c). The background color in Fig. 7 indicates the
difference in the velocity magnitude between the space-time interpolated currents
and the respective currents of the background model run u
m (x, t). Most of the
data-induced changes are observed in the northern part of the harbor with the major
difference (≈0.30 m/s) at the periphery of the eddy, showing significant modifications of the circulation pattern provided by the interpolation.
Summary
Currents of several meters per second can never be experienced in the open ocean
but could be encountered in straits and nearshore regions due to the interaction of
tidal waves with topography. Although regions of such extreme currents are sparse,
in situ observations of local flows are very difficult to perform due to extreme
environmental conditions. Static velocity measurements performed by either
bottom-mounted or moored ADCPs do not allow to adequately characterize neither
the spatial structure of the flow nor its long-term variation. In this chapter, we
presented two complimentary flow monitoring techniques that could be suitable for
continuous observations of the extreme currents.
The first type of reported observations was provided by two HFR networks
operated along the French coast, in the western and eastern sectors of the English
Channel. The HFR-derived velocities of surface currents were analyzed by means
of various numerical and statistical techniques. In particular, processing long-term
HFR observations in the W. Brittany provided maps of surface currents in
Fig. 7 a Observed (red) and modelled (gray) surface velocity fields during the towed ADCP
surveys in Boulogne Harbour on March 27, 2012 1200–1400 GMT. Evolution of the anticyclonic
eddy from HW − 1.2 h (b) to HW + 0.5 h (c). Red arrows show 30-s averaged ADCP velocities
recorded along the track for the respective tidal stages. Blue arrows show interpolated velocities.
Background shading shows the difference between the survey velocities interpolated in space and
time and model velocities at mid-time of the survey
532
A. Sentchev et al.