

experiment had an identical configuration except that the 4Dvar MDOT was
replaced by the RIO05 MDOT (Fig. 3c).
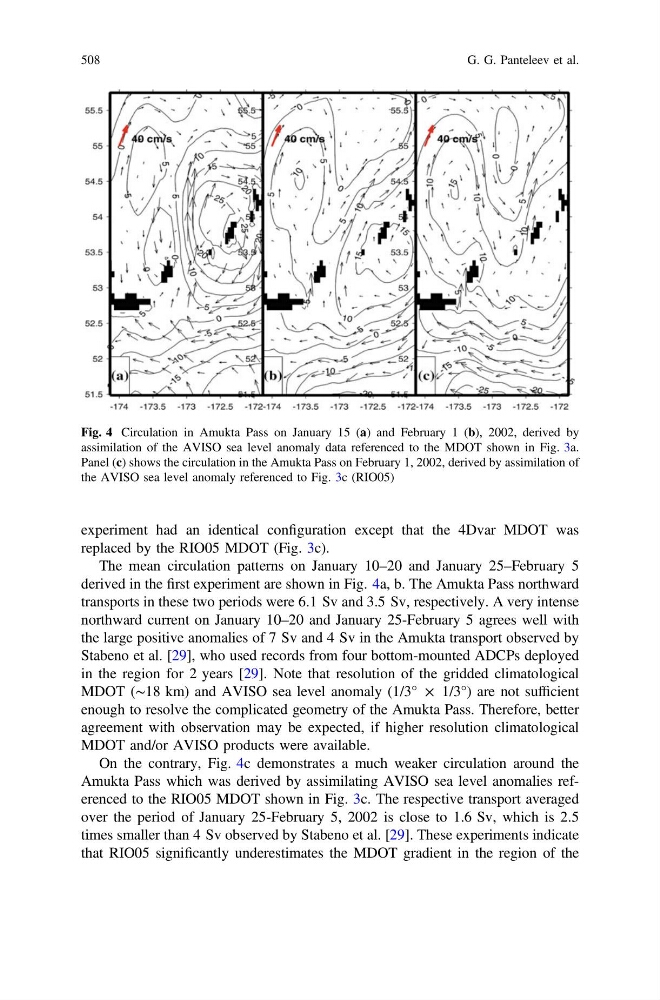
The mean circulation patterns on January 10–20 and January 25–February 5
derived in the first experiment are shown in Fig. 4a, b. The Amukta Pass northward
transports in these two periods were 6.1 Sv and 3.5 Sv, respectively. A very intense
northward current on January 10–20 and January 25-February 5 agrees well with
the large positive anomalies of 7 Sv and 4 Sv in the Amukta transport observed by
Stabeno et al. [29], who used records from four bottom-mounted ADCPs deployed
in the region for 2 years [29]. Note that resolution of the gridded climatological
MDOT (∼18 km) and AVISO sea level anomaly (1/3° × 1/3°) are not sufficient
enough to resolve the complicated geometry of the Amukta Pass. Therefore, better
agreement with observation may be expected, if higher resolution climatological
MDOT and/or AVISO products were available.
On the contrary, Fig. 4c demonstrates a much weaker circulation around the
Amukta Pass which was derived by assimilating AVISO sea level anomalies referenced to the RIO05 MDOT shown in Fig. 3c. The respective transport averaged
over the period of January 25-February 5, 2002 is close to 1.6 Sv, which is 2.5
times smaller than 4 Sv observed by Stabeno et al. [29]. These experiments indicate
that RIO05 significantly underestimates the MDOT gradient in the region of the
Fig. 4 Circulation in Amukta Pass on January 15 (a) and February 1 (b), 2002, derived by
assimilation of the AVISO sea level anomaly data referenced to the MDOT shown in Fig. 3a.
Panel (c) shows the circulation in the Amukta Pass on February 1, 2002, derived by assimilation of
the AVISO sea level anomaly referenced to Fig. 3c (RIO05)
508
G. G. Panteleev et al.
replaced by the RIO05 MDOT (Fig. 3c).
The mean circulation patterns on January 10–20 and January 25–February 5
derived in the first experiment are shown in Fig. 4a, b. The Amukta Pass northward
transports in these two periods were 6.1 Sv and 3.5 Sv, respectively. A very intense
northward current on January 10–20 and January 25-February 5 agrees well with
the large positive anomalies of 7 Sv and 4 Sv in the Amukta transport observed by
Stabeno et al. [29], who used records from four bottom-mounted ADCPs deployed
in the region for 2 years [29]. Note that resolution of the gridded climatological
MDOT (∼18 km) and AVISO sea level anomaly (1/3° × 1/3°) are not sufficient
enough to resolve the complicated geometry of the Amukta Pass. Therefore, better
agreement with observation may be expected, if higher resolution climatological
MDOT and/or AVISO products were available.
On the contrary, Fig. 4c demonstrates a much weaker circulation around the
Amukta Pass which was derived by assimilating AVISO sea level anomalies referenced to the RIO05 MDOT shown in Fig. 3c. The respective transport averaged
over the period of January 25-February 5, 2002 is close to 1.6 Sv, which is 2.5
times smaller than 4 Sv observed by Stabeno et al. [29]. These experiments indicate
that RIO05 significantly underestimates the MDOT gradient in the region of the
Fig. 4 Circulation in Amukta Pass on January 15 (a) and February 1 (b), 2002, derived by
assimilation of the AVISO sea level anomaly data referenced to the MDOT shown in Fig. 3a.
Panel (c) shows the circulation in the Amukta Pass on February 1, 2002, derived by assimilation of
the AVISO sea level anomaly referenced to Fig. 3c (RIO05)
508
G. G. Panteleev et al.