

along the Vema Channel (33° 34′, 32° 17′, 31° 12′, 28° 55′, 26° 40′ S) in 2009,
2010, 2014, and 2017. We also report about our new hydrographic measurements
performed over the Santos Plateau in the spring and autumn seasons of 2016.
Data and Methods
We used both experimental and simulated velocity data to analyze the bottom
currents in the region. The hydrographic data were measured at a few locations
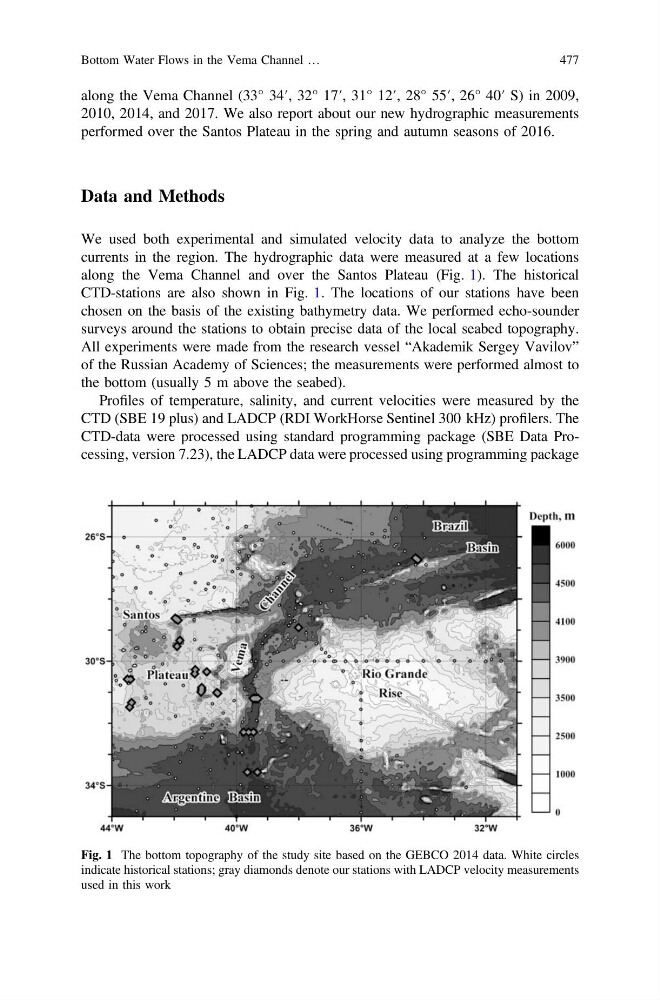
along the Vema Channel and over the Santos Plateau (Fig. 1). The historical
CTD-stations are also shown in Fig. 1. The locations of our stations have been
chosen on the basis of the existing bathymetry data. We performed echo-sounder
surveys around the stations to obtain precise data of the local seabed topography.
All experiments were made from the research vessel “Akademik Sergey Vavilov”
of the Russian Academy of Sciences; the measurements were performed almost to
the bottom (usually 5 m above the seabed).
Profiles of temperature, salinity, and current velocities were measured by the
CTD (SBE 19 plus) and LADCP (RDI WorkHorse Sentinel 300 kHz) profilers. The
CTD-data were processed using standard programming package (SBE Data Processing, version 7.23), the LADCP data were processed using programming package
Fig. 1 The bottom topography of the study site based on the GEBCO 2014 data. White circles
indicate historical stations; gray diamonds denote our stations with LADCP velocity measurements
used in this work
Bottom Water Flows in the Vema Channel …
477
2010, 2014, and 2017. We also report about our new hydrographic measurements
performed over the Santos Plateau in the spring and autumn seasons of 2016.
Data and Methods
We used both experimental and simulated velocity data to analyze the bottom
currents in the region. The hydrographic data were measured at a few locations
along the Vema Channel and over the Santos Plateau (Fig. 1). The historical
CTD-stations are also shown in Fig. 1. The locations of our stations have been
chosen on the basis of the existing bathymetry data. We performed echo-sounder
surveys around the stations to obtain precise data of the local seabed topography.
All experiments were made from the research vessel “Akademik Sergey Vavilov”
of the Russian Academy of Sciences; the measurements were performed almost to
the bottom (usually 5 m above the seabed).
Profiles of temperature, salinity, and current velocities were measured by the
CTD (SBE 19 plus) and LADCP (RDI WorkHorse Sentinel 300 kHz) profilers. The
CTD-data were processed using standard programming package (SBE Data Processing, version 7.23), the LADCP data were processed using programming package
Fig. 1 The bottom topography of the study site based on the GEBCO 2014 data. White circles
indicate historical stations; gray diamonds denote our stations with LADCP velocity measurements
used in this work
Bottom Water Flows in the Vema Channel …
477