

intervals of the neutral stability to the slight instability. The density ratio at such
intervals varies from high negative to high positive numbers. The variations in R ρ at
minimal to negative E θ, S and minimal T and S gradients only indicate the small
local changes in the conditions of well mixed layers, and some incidental intervals
with 1 < R ρ < 2 are not related here to the double diffusion convection as the whole
situation does not meet the second criteria. Neutral to unstable background stratification excludes the development of double diffusion convection in such
well-mixed depth intervals in spite of some occurrence of low positive density ratio
within them.
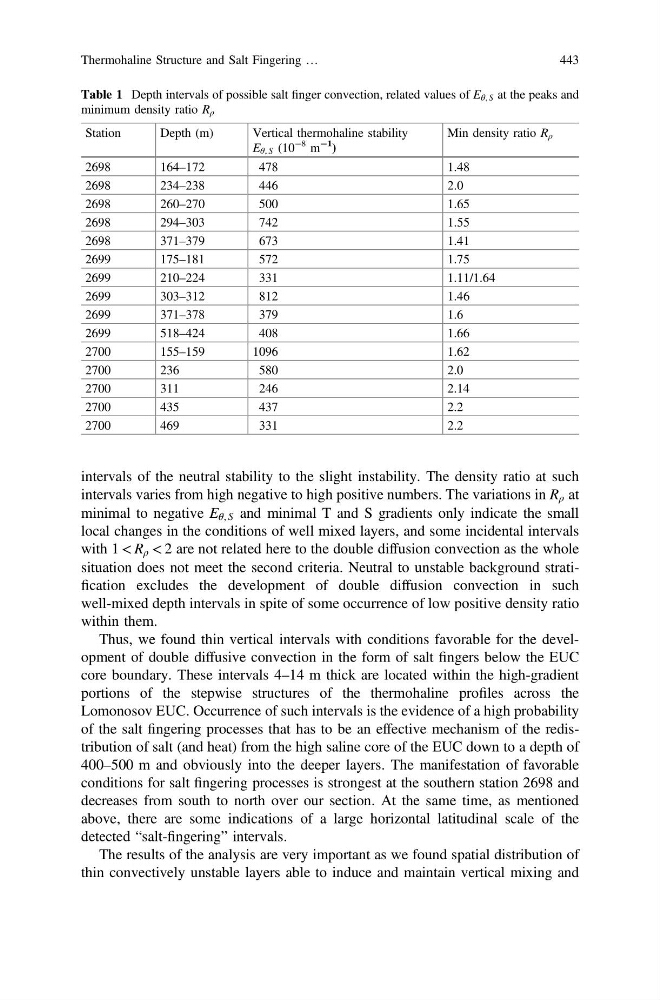
Thus, we found thin vertical intervals with conditions favorable for the development of double diffusive convection in the form of salt fingers below the EUC
core boundary. These intervals 4–14 m thick are located within the high-gradient
portions of the stepwise structures of the thermohaline profiles across the
Lomonosov EUC. Occurrence of such intervals is the evidence of a high probability
of the salt fingering processes that has to be an effective mechanism of the redistribution of salt (and heat) from the high saline core of the EUC down to a depth of
400–500 m and obviously into the deeper layers. The manifestation of favorable
conditions for salt fingering processes is strongest at the southern station 2698 and
decreases from south to north over our section. At the same time, as mentioned
above, there are some indications of a large horizontal latitudinal scale of the
detected “salt-fingering” intervals.
The results of the analysis are very important as we found spatial distribution of
thin convectively unstable layers able to induce and maintain vertical mixing and
Table 1 Depth intervals of possible salt finger convection, related values of E θ, S at the peaks and
minimum density ratio R ρ
Station
Depth (m)
Vertical thermohaline stability
E θ, S (10
−8 m
−1
)
Min density ratio R ρ
2698
164–172
478
1.48
2698
234–238
446
2.0
2698
260–270
500
1.65
2698
294–303
742
1.55
2698
371–379
673
1.41
2699
175–181
572
1.75
2699
210–224
331
1.11/1.64
2699
303–312
812
1.46
2699
371–378
379
1.6
2699
518–424
408
1.66
2700
155–159
1096
1.62
2700
236
580
2.0
2700
311
246
2.14
2700
435
437
2.2
2700
469
331
2.2
Thermohaline Structure and Salt Fingering …
443
intervals varies from high negative to high positive numbers. The variations in R ρ at
minimal to negative E θ, S and minimal T and S gradients only indicate the small
local changes in the conditions of well mixed layers, and some incidental intervals
with 1 < R ρ < 2 are not related here to the double diffusion convection as the whole
situation does not meet the second criteria. Neutral to unstable background stratification excludes the development of double diffusion convection in such
well-mixed depth intervals in spite of some occurrence of low positive density ratio
within them.
Thus, we found thin vertical intervals with conditions favorable for the development of double diffusive convection in the form of salt fingers below the EUC
core boundary. These intervals 4–14 m thick are located within the high-gradient
portions of the stepwise structures of the thermohaline profiles across the
Lomonosov EUC. Occurrence of such intervals is the evidence of a high probability
of the salt fingering processes that has to be an effective mechanism of the redistribution of salt (and heat) from the high saline core of the EUC down to a depth of
400–500 m and obviously into the deeper layers. The manifestation of favorable
conditions for salt fingering processes is strongest at the southern station 2698 and
decreases from south to north over our section. At the same time, as mentioned
above, there are some indications of a large horizontal latitudinal scale of the
detected “salt-fingering” intervals.
The results of the analysis are very important as we found spatial distribution of
thin convectively unstable layers able to induce and maintain vertical mixing and
Table 1 Depth intervals of possible salt finger convection, related values of E θ, S at the peaks and
minimum density ratio R ρ
Station
Depth (m)
Vertical thermohaline stability
E θ, S (10
−8 m
−1
)
Min density ratio R ρ
2698
164–172
478
1.48
2698
234–238
446
2.0
2698
260–270
500
1.65
2698
294–303
742
1.55
2698
371–379
673
1.41
2699
175–181
572
1.75
2699
210–224
331
1.11/1.64
2699
303–312
812
1.46
2699
371–378
379
1.6
2699
518–424
408
1.66
2700
155–159
1096
1.62
2700
236
580
2.0
2700
311
246
2.14
2700
435
437
2.2
2700
469
331
2.2
Thermohaline Structure and Salt Fingering …
443