

deep water production rates, which results in slowing of the Atlantic MOC (e.g.,
[11, 12]
To better understand the past and present changes in the ocean-atmosphere
dynamical system, as well as their causes and consequences, data on the full-depth
oceanic variability are needed. An indispensable effective tool for assessing the
large-scale circulation and thermohaline changes in the deep ocean and investigating mechanisms governing these changes are repeated full-depth transoceanic
observations.
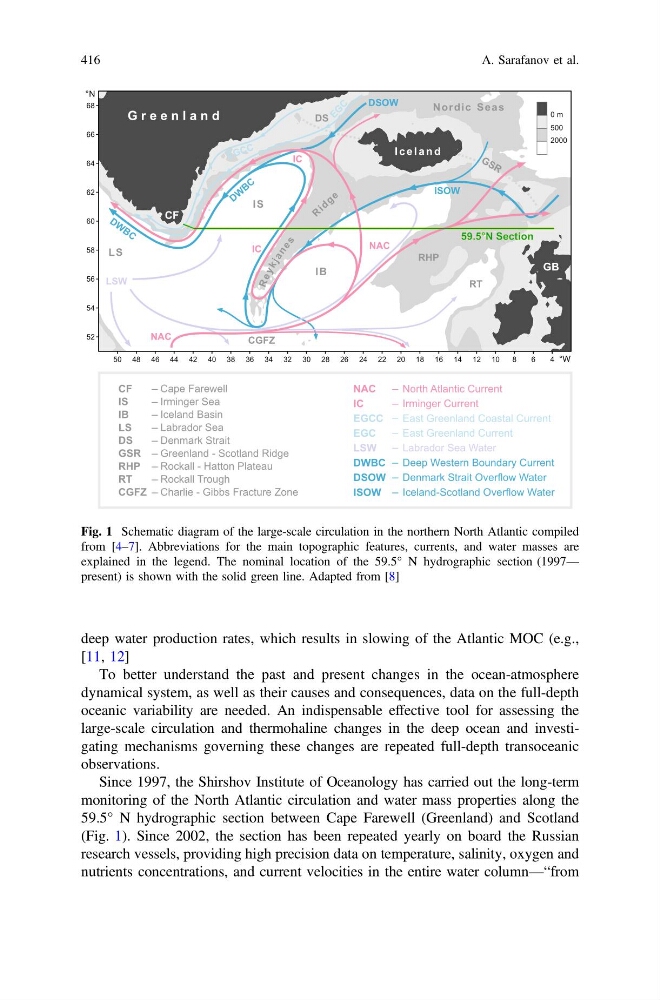
Since 1997, the Shirshov Institute of Oceanology has carried out the long-term
monitoring of the North Atlantic circulation and water mass properties along the
59.5° N hydrographic section between Cape Farewell (Greenland) and Scotland
(Fig. 1). Since 2002, the section has been repeated yearly on board the Russian
research vessels, providing high precision data on temperature, salinity, oxygen and
nutrients concentrations, and current velocities in the entire water column—“from
NAC
IC
EGCC
EGC
LSW
DWBC
DSOW
ISOW
North Atlantic Current
Irminger Current
East Greenland Coastal Current
East Greenland Current
Labrador Sea Water
Deep Western Boundary Current
Denmark Strait Overflow Water
Iceland-Scotland Overflow Water
50 48 46 44 42 40 38 36 34 32 30 28 26 24 22 20 18 16 14 12 10
8
6
4 °W
52
54
56
58
60
62
64
66
68
G r e e n l a n d
I c e l a n d
2000
500
0 m
CGFZ
IS
LS
IB
e
g
d
i
R
s
e
n
a
j
k
y
e
R
Nordic Seas
GB
RT
RHP
E G C C
E G
C
DS
NAC
DSOW
ISOW
LSW
G S R
IC
D W
B C
D W B C
°N
NAC
Cape Farewell
–
Irminger Sea
–
Iceland Basin
–
Labrador Sea
–
Denmark Strait
–
Greenland - Scotland Ridge
–
Rockall - Hatton Plateau
–
Rockall Trough
–
Charlie - Gibbs Fracture Zone
–
–
–
–
–
–
–
–
–
CF
IS
IB
LS
DS
GSR
RHP
RT
CGFZ
CF
IC
59.5°N Section
Fig. 1 Schematic diagram of the large-scale circulation in the northern North Atlantic compiled
from [4–7]. Abbreviations for the main topographic features, currents, and water masses are
explained in the legend. The nominal location of the 59.5° N hydrographic section (1997—
present) is shown with the solid green line. Adapted from [8]
416
A. Sarafanov et al.
[11, 12]
To better understand the past and present changes in the ocean-atmosphere
dynamical system, as well as their causes and consequences, data on the full-depth
oceanic variability are needed. An indispensable effective tool for assessing the
large-scale circulation and thermohaline changes in the deep ocean and investigating mechanisms governing these changes are repeated full-depth transoceanic
observations.
Since 1997, the Shirshov Institute of Oceanology has carried out the long-term
monitoring of the North Atlantic circulation and water mass properties along the
59.5° N hydrographic section between Cape Farewell (Greenland) and Scotland
(Fig. 1). Since 2002, the section has been repeated yearly on board the Russian
research vessels, providing high precision data on temperature, salinity, oxygen and
nutrients concentrations, and current velocities in the entire water column—“from
NAC
IC
EGCC
EGC
LSW
DWBC
DSOW
ISOW
North Atlantic Current
Irminger Current
East Greenland Coastal Current
East Greenland Current
Labrador Sea Water
Deep Western Boundary Current
Denmark Strait Overflow Water
Iceland-Scotland Overflow Water
50 48 46 44 42 40 38 36 34 32 30 28 26 24 22 20 18 16 14 12 10
8
6
4 °W
52
54
56
58
60
62
64
66
68
G r e e n l a n d
I c e l a n d
2000
500
0 m
CGFZ
IS
LS
IB
e
g
d
i
R
s
e
n
a
j
k
y
e
R
Nordic Seas
GB
RT
RHP
E G C C
E G
C
DS
NAC
DSOW
ISOW
LSW
G S R
IC
D W
B C
D W B C
°N
NAC
Cape Farewell
–
Irminger Sea
–
Iceland Basin
–
Labrador Sea
–
Denmark Strait
–
Greenland - Scotland Ridge
–
Rockall - Hatton Plateau
–
Rockall Trough
–
Charlie - Gibbs Fracture Zone
–
–
–
–
–
–
–
–
–
CF
IS
IB
LS
DS
GSR
RHP
RT
CGFZ
CF
IC
59.5°N Section
Fig. 1 Schematic diagram of the large-scale circulation in the northern North Atlantic compiled
from [4–7]. Abbreviations for the main topographic features, currents, and water masses are
explained in the legend. The nominal location of the 59.5° N hydrographic section (1997—
present) is shown with the solid green line. Adapted from [8]
416
A. Sarafanov et al.