

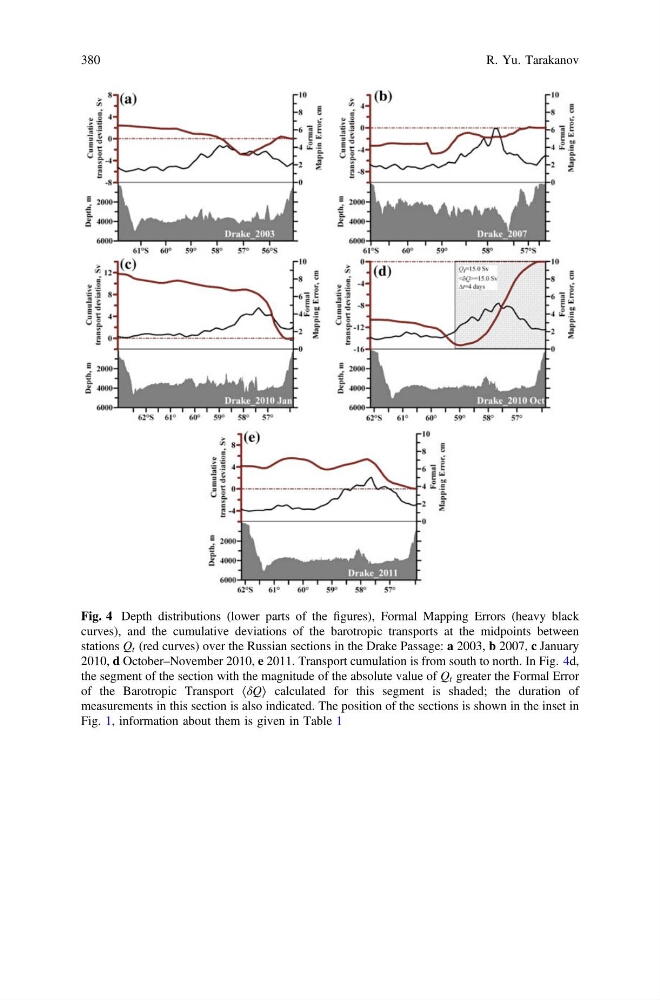
Fig. 4 Depth distributions (lower parts of the figures), Formal Mapping Errors (heavy black
curves), and the cumulative deviations of the barotropic transports at the midpoints between
stations Q t (red curves) over the Russian sections in the Drake Passage: a 2003, b 2007, c January
2010, d October–November 2010, e 2011. Transport cumulation is from south to north. In Fig. 4d,
the segment of the section with the magnitude of the absolute value of Q t greater the Formal Error
of the Barotropic Transport ⟨δQ⟩ calculated for this segment is shaded; the duration of
measurements in this section is also indicated. The position of the sections is shown in the inset in
Fig. 1, information about them is given in Table 1
380
R. Yu. Tarakanov
curves), and the cumulative deviations of the barotropic transports at the midpoints between
stations Q t (red curves) over the Russian sections in the Drake Passage: a 2003, b 2007, c January
2010, d October–November 2010, e 2011. Transport cumulation is from south to north. In Fig. 4d,
the segment of the section with the magnitude of the absolute value of Q t greater the Formal Error
of the Barotropic Transport ⟨δQ⟩ calculated for this segment is shaded; the duration of
measurements in this section is also indicated. The position of the sections is shown in the inset in
Fig. 1, information about them is given in Table 1
380
R. Yu. Tarakanov