

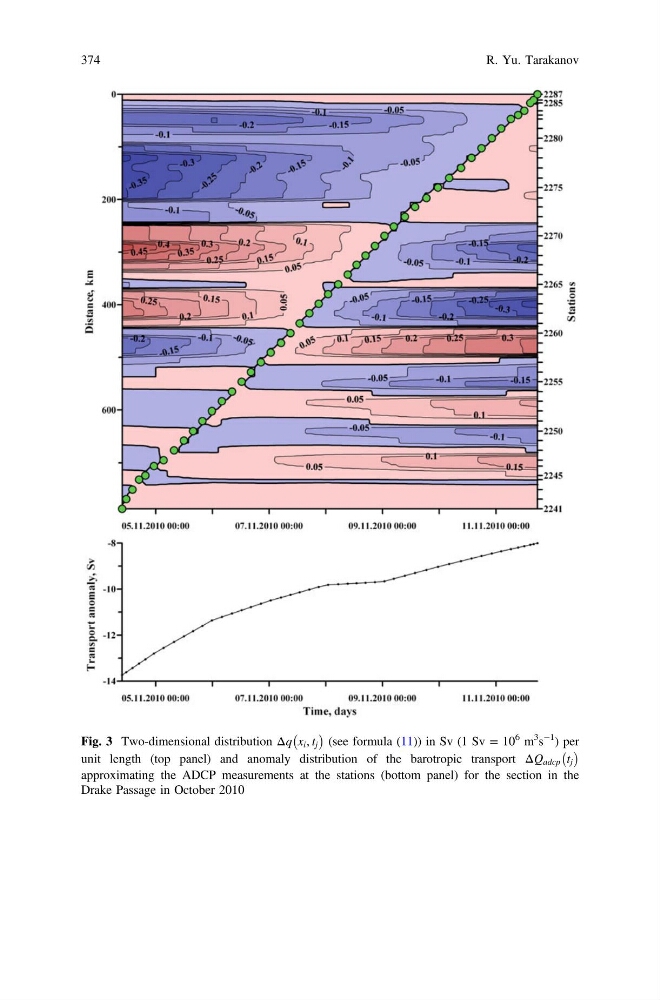
Fig. 3 Two-dimensional distribution Δq x i , t j
À
Á
(see formula (11)) in Sv (1 Sv = 10
6 m
3
s
−1
) per
unit length (top panel) and anomaly distribution of the barotropic transport ΔQ adcp t j
À Á
approximating the ADCP measurements at the stations (bottom panel) for the section in the
Drake Passage in October 2010
374
R. Yu. Tarakanov
À
Á
(see formula (11)) in Sv (1 Sv = 10
6 m
3
s
−1
) per
unit length (top panel) and anomaly distribution of the barotropic transport ΔQ adcp t j
À Á
approximating the ADCP measurements at the stations (bottom panel) for the section in the
Drake Passage in October 2010
374
R. Yu. Tarakanov