

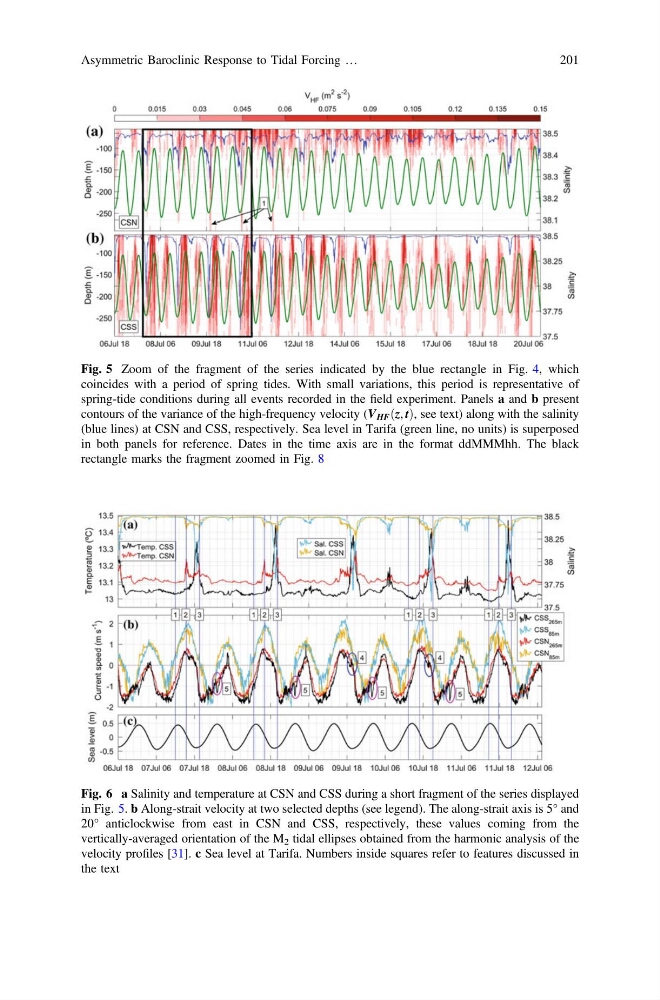
Fig. 5 Zoom of the fragment of the series indicated by the blue rectangle in Fig. 4, which
coincides with a period of spring tides. With small variations, this period is representative of
spring-tide conditions during all events recorded in the field experiment. Panels a and b present
contours of the variance of the high-frequency velocity (V HF z, t
ð Þ, see text) along with the salinity
(blue lines) at CSN and CSS, respectively. Sea level in Tarifa (green line, no units) is superposed
in both panels for reference. Dates in the time axis are in the format ddMMMhh. The black
rectangle marks the fragment zoomed in Fig. 8
Fig. 6 a Salinity and temperature at CSN and CSS during a short fragment of the series displayed
in Fig. 5. b Along-strait velocity at two selected depths (see legend). The along-strait axis is 5° and
20° anticlockwise from east in CSN and CSS, respectively, these values coming from the
vertically-averaged orientation of the M 2 tidal ellipses obtained from the harmonic analysis of the
velocity profiles [31]. c Sea level at Tarifa. Numbers inside squares refer to features discussed in
the text
Asymmetric Baroclinic Response to Tidal Forcing …
201
coincides with a period of spring tides. With small variations, this period is representative of
spring-tide conditions during all events recorded in the field experiment. Panels a and b present
contours of the variance of the high-frequency velocity (V HF z, t
ð Þ, see text) along with the salinity
(blue lines) at CSN and CSS, respectively. Sea level in Tarifa (green line, no units) is superposed
in both panels for reference. Dates in the time axis are in the format ddMMMhh. The black
rectangle marks the fragment zoomed in Fig. 8
Fig. 6 a Salinity and temperature at CSN and CSS during a short fragment of the series displayed
in Fig. 5. b Along-strait velocity at two selected depths (see legend). The along-strait axis is 5° and
20° anticlockwise from east in CSN and CSS, respectively, these values coming from the
vertically-averaged orientation of the M 2 tidal ellipses obtained from the harmonic analysis of the
velocity profiles [31]. c Sea level at Tarifa. Numbers inside squares refer to features discussed in
the text
Asymmetric Baroclinic Response to Tidal Forcing …
201