

through which the densest Mediterranean waters must flow. CSN channel is shallower (thalweg at −300 m, see inset in Fig. 1b), narrower (∼2 km at 200 m-depth
isobaths), has a smooth U-shaped form and favors the evacuation of waters flowing
along the northern half of the Strait, whereas CSS has a more V-like profile, is
slightly deeper (thalweg at −310 m, Fig. 1) and broader (∼4.5 km at −200 m). The
thalwegs distance is ∼5 km. The ratio of cross-areas (CSN/CSS) below 200 m depth
is 1:2 approximately, which suggests similar fractions of the outflow across each
channel. The Mediterranean waters flowing through them have slightly different
characteristics due to the tendency of the relatively warm and salty Levantine
Intermediate water (LIW) to flow closer to the Spanish shore and the Western
Mediterranean Deep water (WMDW), colder and fresher, to flow attached to the
Moroccan coast [20–22], see sketch in Fig. 1a. Therefore, LIW and WMDW will
flow in greater proportion across CSN and CSS, respectively (see Fig. 4 in García-Lafuente et al. [19]).
Of particular interest are the closed depressions at either side of CS (LB and PB
in Fig. 1b), which display erosive features. Quite probably, they have been carved
out by strong flows that have had to pour down from the top of the sills of
Camarinal in the flood (PB) and ebb (LB) tides, that is, by the supercritical flows
associated with the alternating formation of hydraulic jumps at either side of CS.
The asymmetry imposed by the background baroclinic exchange, which reinforces
flood and weakens ebb tidal currents in the deeper layer, would accordingly explain
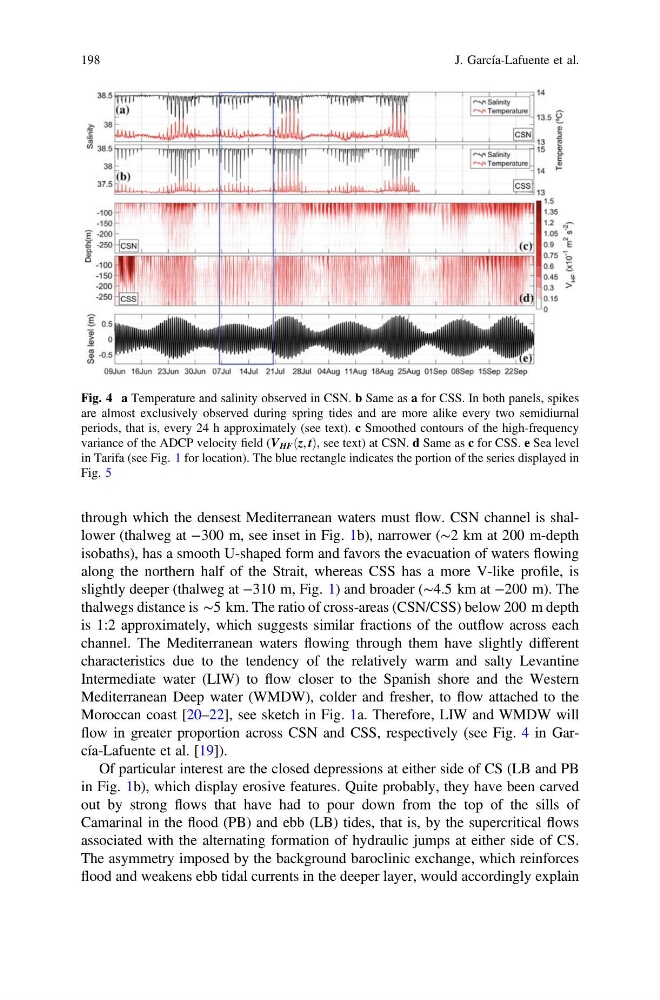
Fig. 4 a Temperature and salinity observed in CSN. b Same as a for CSS. In both panels, spikes
are almost exclusively observed during spring tides and are more alike every two semidiurnal
periods, that is, every 24 h approximately (see text). c Smoothed contours of the high-frequency
variance of the ADCP velocity field (V HF z, t
ð Þ, see text) at CSN. d Same as c for CSS. e Sea level
in Tarifa (see Fig. 1 for location). The blue rectangle indicates the portion of the series displayed in
Fig. 5
198
J. García-Lafuente et al.
isobaths), has a smooth U-shaped form and favors the evacuation of waters flowing
along the northern half of the Strait, whereas CSS has a more V-like profile, is
slightly deeper (thalweg at −310 m, Fig. 1) and broader (∼4.5 km at −200 m). The
thalwegs distance is ∼5 km. The ratio of cross-areas (CSN/CSS) below 200 m depth
is 1:2 approximately, which suggests similar fractions of the outflow across each
channel. The Mediterranean waters flowing through them have slightly different
characteristics due to the tendency of the relatively warm and salty Levantine
Intermediate water (LIW) to flow closer to the Spanish shore and the Western
Mediterranean Deep water (WMDW), colder and fresher, to flow attached to the
Moroccan coast [20–22], see sketch in Fig. 1a. Therefore, LIW and WMDW will
flow in greater proportion across CSN and CSS, respectively (see Fig. 4 in García-Lafuente et al. [19]).
Of particular interest are the closed depressions at either side of CS (LB and PB
in Fig. 1b), which display erosive features. Quite probably, they have been carved
out by strong flows that have had to pour down from the top of the sills of
Camarinal in the flood (PB) and ebb (LB) tides, that is, by the supercritical flows
associated with the alternating formation of hydraulic jumps at either side of CS.
The asymmetry imposed by the background baroclinic exchange, which reinforces
flood and weakens ebb tidal currents in the deeper layer, would accordingly explain
Fig. 4 a Temperature and salinity observed in CSN. b Same as a for CSS. In both panels, spikes
are almost exclusively observed during spring tides and are more alike every two semidiurnal
periods, that is, every 24 h approximately (see text). c Smoothed contours of the high-frequency
variance of the ADCP velocity field (V HF z, t
ð Þ, see text) at CSN. d Same as c for CSS. e Sea level
in Tarifa (see Fig. 1 for location). The blue rectangle indicates the portion of the series displayed in
Fig. 5
198
J. García-Lafuente et al.