

barotropic tide with the sloping bottom topography. The amplitudes (peak to peak
displacements) of internal tides over the continental slope are sometimes as high as
almost 80 m. They decrease in the open ocean to 30 m.
Acknowledgements This work was supported by the Russian Science Foundation (project no.
14-50-00095).
References
1. Baines, P. G. (1982). On internal tide generation models. Deep-Sea Research, 29(3),
307–338.
2. Morozov, E. G. (1995). Semidiurnal internal wave global field. Deep-Sea Research, 42(1),
135–148.
3. Li, Q., & Farmer, D. M. (2011). The generation and evolution of nonlinear internal waves in
the deep basin of the South China Sea. Journal of Physical Oceanography, 41, 1345–1363.
4. Morozov, E. G., & Vlasenko, V. I. (1996). Extreme tidal internal waves near the Mascarene
Ridge. J. Marine Systems, 9(3–4), 203–210.
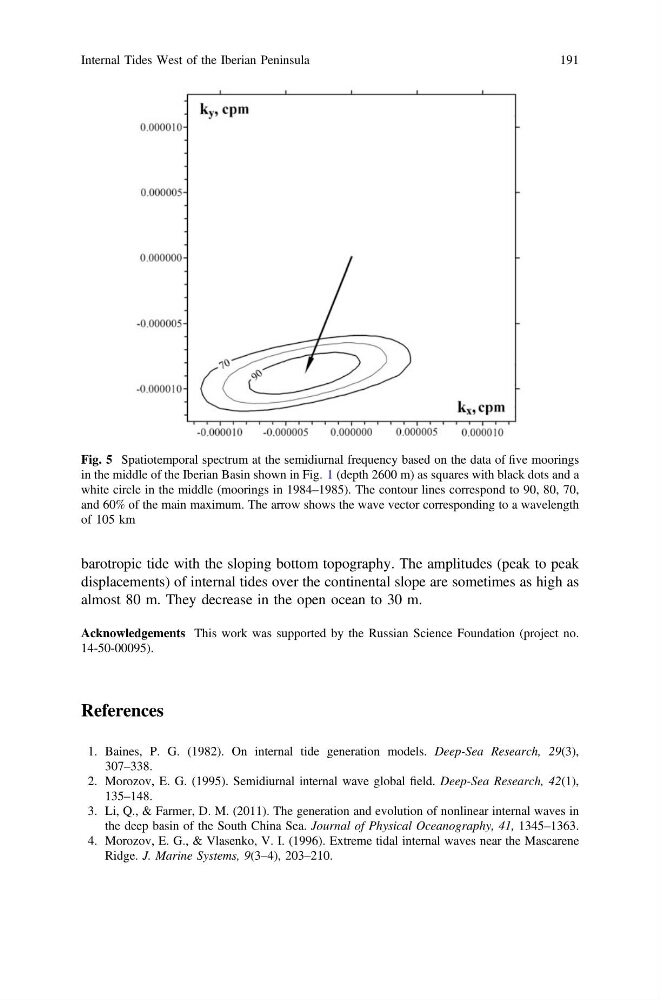
Fig. 5 Spatiotemporal spectrum at the semidiurnal frequency based on the data of five moorings
in the middle of the Iberian Basin shown in Fig. 1 (depth 2600 m) as squares with black dots and a
white circle in the middle (moorings in 1984–1985). The contour lines correspond to 90, 80, 70,
and 60% of the main maximum. The arrow shows the wave vector corresponding to a wavelength
of 105 km
Internal Tides West of the Iberian Peninsula
191
displacements) of internal tides over the continental slope are sometimes as high as
almost 80 m. They decrease in the open ocean to 30 m.
Acknowledgements This work was supported by the Russian Science Foundation (project no.
14-50-00095).
References
1. Baines, P. G. (1982). On internal tide generation models. Deep-Sea Research, 29(3),
307–338.
2. Morozov, E. G. (1995). Semidiurnal internal wave global field. Deep-Sea Research, 42(1),
135–148.
3. Li, Q., & Farmer, D. M. (2011). The generation and evolution of nonlinear internal waves in
the deep basin of the South China Sea. Journal of Physical Oceanography, 41, 1345–1363.
4. Morozov, E. G., & Vlasenko, V. I. (1996). Extreme tidal internal waves near the Mascarene
Ridge. J. Marine Systems, 9(3–4), 203–210.
Fig. 5 Spatiotemporal spectrum at the semidiurnal frequency based on the data of five moorings
in the middle of the Iberian Basin shown in Fig. 1 (depth 2600 m) as squares with black dots and a
white circle in the middle (moorings in 1984–1985). The contour lines correspond to 90, 80, 70,
and 60% of the main maximum. The arrow shows the wave vector corresponding to a wavelength
of 105 km
Internal Tides West of the Iberian Peninsula
191