

176
L. R. M. Maas et al.
0
30
60
90
120
150
180
210
240
270
300
330
0
2
4
6
8
10
0
30
60
90
120
150
180
210
240
270
300
330
0
2
4
6
8
10
0
30
60
90
120
150
180
210
240
270
300
330
0
2
4
6
8
10
0
30
60
90
120
150
180
210
240
270
300
330
0
2
4
6
8
10
0
30
60
90
120
150
180
210
240
270
300
330
0
2
4
6
8
10
0
30
60
90
120
150
180
210
240
270
300
330
0
2
4
6
8
10
0
30
60
90
120
150
180
210
240
270
300
330
0
2
4
6
8
10
0
30
60
90
120
150
180
210
240
270
300
330
0
2
4
6
8
10
0
30
60
90
120
150
180
210
240
270
300
330
0
2
4
6
8
10
0
30
60
90
120
150
180
210
240
270
300
330
0
2
4
6
8
10
0
30
60
90
120
150
180
210
240
270
300
330
0
2
4
6
8
10
0
30
60
90
120
150
180
210
240
270
300
330
0
2
4
6
8
10
0
30
60
90
120
150
180
210
240
270
300
330
0
2
4
6
8
10
0
30
60
90
120
150
180
210
240
270
300
330
0
2
4
6
8
10
0
30
60
90
120
150
180
210
240
270
300
330
0
2
4
6
8
10
0
30
60
90
120
150
180
210
240
270
300
330
0
2
4
6
8
10
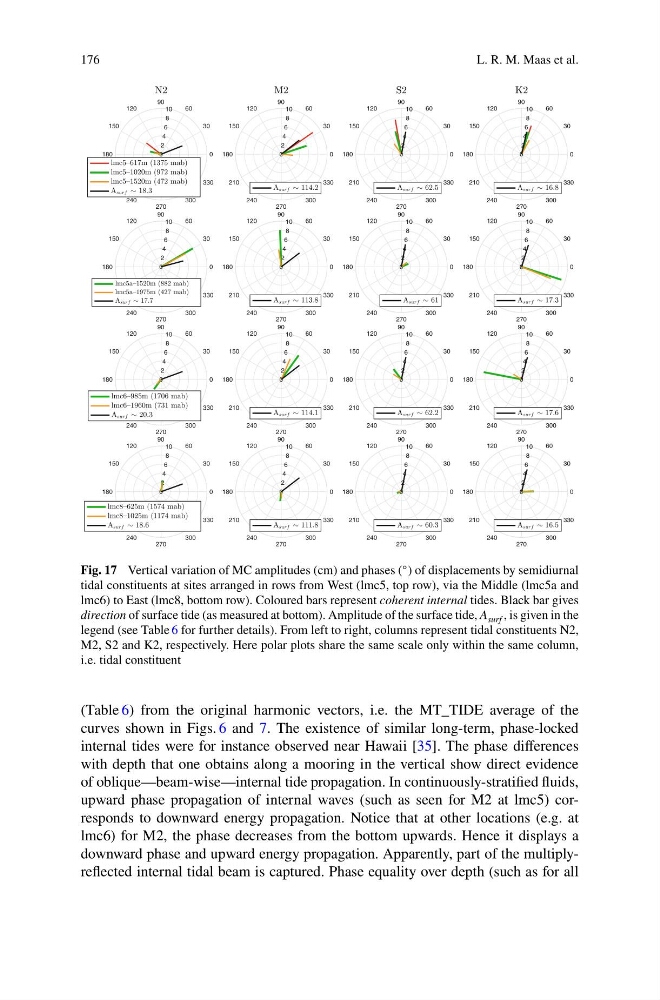
Fig. 17 Vertical variation of MC amplitudes (cm) and phases (
◦ ) of displacements by semidiurnal
tidal constituents at sites arranged in rows from West (lmc5, top row), via the Middle (lmc5a and
lmc6) to East (lmc8, bottom row). Coloured bars represent coherent internal tides. Black bar gives
direction of surface tide (as measured at bottom). Amplitude of the surface tide, A surf , is given in the
legend (see Table 6 for further details). From left to right, columns represent tidal constituents N2,
M2, S2 and K2, respectively. Here polar plots share the same scale only within the same column,
i.e. tidal constituent
(Table 6) from the original harmonic vectors, i.e. the MT_TIDE average of the
curves shown in Figs. 6 and 7. The existence of similar long-term, phase-locked
internal tides were for instance observed near Hawaii [35]. The phase differences
with depth that one obtains along a mooring in the vertical show direct evidence
of oblique—beam-wise—internal tide propagation. In continuously-stratified fluids,
upward phase propagation of internal waves (such as seen for M2 at lmc5) corresponds to downward energy propagation. Notice that at other locations (e.g. at
lmc6) for M2, the phase decreases from the bottom upwards. Hence it displays a
downward phase and upward energy propagation. Apparently, part of the multiplyreflected internal tidal beam is captured. Phase equality over depth (such as for all
L. R. M. Maas et al.
0
30
60
90
120
150
180
210
240
270
300
330
0
2
4
6
8
10
0
30
60
90
120
150
180
210
240
270
300
330
0
2
4
6
8
10
0
30
60
90
120
150
180
210
240
270
300
330
0
2
4
6
8
10
0
30
60
90
120
150
180
210
240
270
300
330
0
2
4
6
8
10
0
30
60
90
120
150
180
210
240
270
300
330
0
2
4
6
8
10
0
30
60
90
120
150
180
210
240
270
300
330
0
2
4
6
8
10
0
30
60
90
120
150
180
210
240
270
300
330
0
2
4
6
8
10
0
30
60
90
120
150
180
210
240
270
300
330
0
2
4
6
8
10
0
30
60
90
120
150
180
210
240
270
300
330
0
2
4
6
8
10
0
30
60
90
120
150
180
210
240
270
300
330
0
2
4
6
8
10
0
30
60
90
120
150
180
210
240
270
300
330
0
2
4
6
8
10
0
30
60
90
120
150
180
210
240
270
300
330
0
2
4
6
8
10
0
30
60
90
120
150
180
210
240
270
300
330
0
2
4
6
8
10
0
30
60
90
120
150
180
210
240
270
300
330
0
2
4
6
8
10
0
30
60
90
120
150
180
210
240
270
300
330
0
2
4
6
8
10
0
30
60
90
120
150
180
210
240
270
300
330
0
2
4
6
8
10
Fig. 17 Vertical variation of MC amplitudes (cm) and phases (
◦ ) of displacements by semidiurnal
tidal constituents at sites arranged in rows from West (lmc5, top row), via the Middle (lmc5a and
lmc6) to East (lmc8, bottom row). Coloured bars represent coherent internal tides. Black bar gives
direction of surface tide (as measured at bottom). Amplitude of the surface tide, A surf , is given in the
legend (see Table 6 for further details). From left to right, columns represent tidal constituents N2,
M2, S2 and K2, respectively. Here polar plots share the same scale only within the same column,
i.e. tidal constituent
(Table 6) from the original harmonic vectors, i.e. the MT_TIDE average of the
curves shown in Figs. 6 and 7. The existence of similar long-term, phase-locked
internal tides were for instance observed near Hawaii [35]. The phase differences
with depth that one obtains along a mooring in the vertical show direct evidence
of oblique—beam-wise—internal tide propagation. In continuously-stratified fluids,
upward phase propagation of internal waves (such as seen for M2 at lmc5) corresponds to downward energy propagation. Notice that at other locations (e.g. at
lmc6) for M2, the phase decreases from the bottom upwards. Hence it displays a
downward phase and upward energy propagation. Apparently, part of the multiplyreflected internal tidal beam is captured. Phase equality over depth (such as for all