

Deep-Ocean Tides in the South-West Indian Ocean . . .
167
0
10
20
Amp. (cm)
Q1
0
90
180
270
360
Phase (
◦
)
Q1
0
10
20
Amp. (cm)
O1
0
90
180
270
360
Phase (
◦
)
O1
0
20
40
Amp. (cm)
P1
0
90
180
270
360
Phase (
◦
)
P1
06/11 08/11 10/11 12/11 02/12 04/12 06/12 08/12 10/12
0
20
40
Amp. (cm)
K1
Center Time
06/11 08/11 10/11 12/11 02/12 04/12 06/12 08/12 10/12
0
90
180
270
360
Phase (
◦
)
Center Time
K1
EMC1−0500 (13 mab)
EMC2−0500 (1100 mab)
EMC3−2600 (13 mab)
EMC4−0500 (3300 mab)
EMC5−0500 (3500 mab)
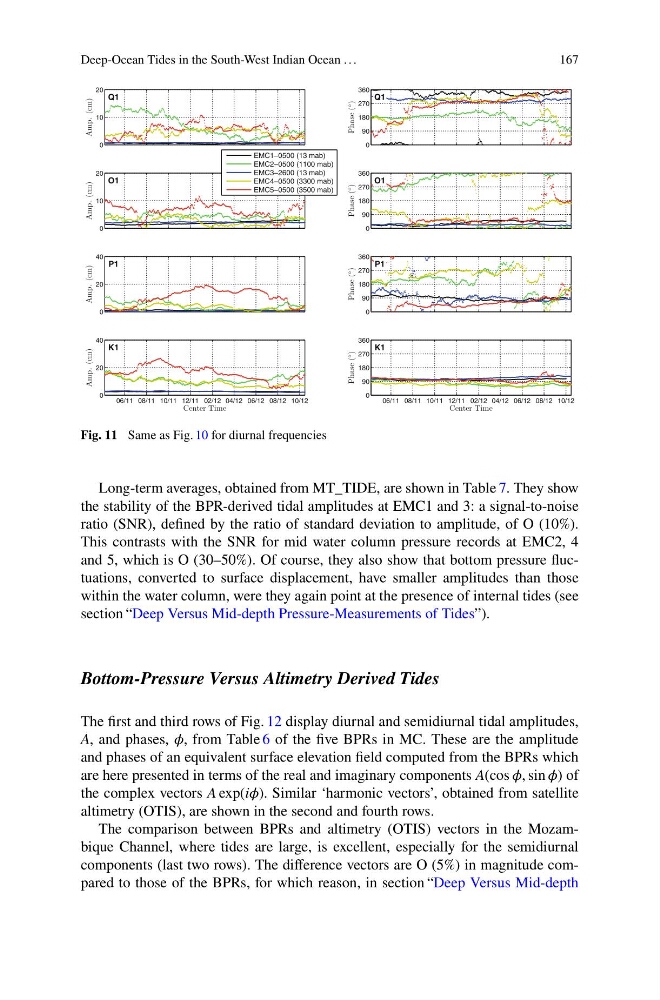
Fig. 11 Same as Fig. 10 for diurnal frequencies
Long-term averages, obtained from MT_TIDE, are shown in Table 7. They show
the stability of the BPR-derived tidal amplitudes at EMC1 and 3: a signal-to-noise
ratio (SNR), defined by the ratio of standard deviation to amplitude, of O (10%).
This contrasts with the SNR for mid water column pressure records at EMC2, 4
and 5, which is O (30–50%). Of course, they also show that bottom pressure fluctuations, converted to surface displacement, have smaller amplitudes than those
within the water column, were they again point at the presence of internal tides (see
section “Deep Versus Mid-depth Pressure-Measurements of Tides”).
Bottom-Pressure Versus Altimetry Derived Tides
The first and third rows of Fig. 12 display diurnal and semidiurnal tidal amplitudes,
A, and phases, í µí¼, from Table 6 of the five BPRs in MC. These are the amplitude
and phases of an equivalent surface elevation field computed from the BPRs which
are here presented in terms of the real and imaginary components A(cos í µí¼, sin í µí¼) of
the complex vectors A exp(ií µí¼). Similar ‘harmonic vectors’, obtained from satellite
altimetry (OTIS), are shown in the second and fourth rows.
The comparison between BPRs and altimetry (OTIS) vectors in the Mozambique Channel, where tides are large, is excellent, especially for the semidiurnal
components (last two rows). The difference vectors are O (5%) in magnitude compared to those of the BPRs, for which reason, in section “Deep Versus Mid-depth
167
0
10
20
Amp. (cm)
Q1
0
90
180
270
360
Phase (
◦
)
Q1
0
10
20
Amp. (cm)
O1
0
90
180
270
360
Phase (
◦
)
O1
0
20
40
Amp. (cm)
P1
0
90
180
270
360
Phase (
◦
)
P1
06/11 08/11 10/11 12/11 02/12 04/12 06/12 08/12 10/12
0
20
40
Amp. (cm)
K1
Center Time
06/11 08/11 10/11 12/11 02/12 04/12 06/12 08/12 10/12
0
90
180
270
360
Phase (
◦
)
Center Time
K1
EMC1−0500 (13 mab)
EMC2−0500 (1100 mab)
EMC3−2600 (13 mab)
EMC4−0500 (3300 mab)
EMC5−0500 (3500 mab)
Fig. 11 Same as Fig. 10 for diurnal frequencies
Long-term averages, obtained from MT_TIDE, are shown in Table 7. They show
the stability of the BPR-derived tidal amplitudes at EMC1 and 3: a signal-to-noise
ratio (SNR), defined by the ratio of standard deviation to amplitude, of O (10%).
This contrasts with the SNR for mid water column pressure records at EMC2, 4
and 5, which is O (30–50%). Of course, they also show that bottom pressure fluctuations, converted to surface displacement, have smaller amplitudes than those
within the water column, were they again point at the presence of internal tides (see
section “Deep Versus Mid-depth Pressure-Measurements of Tides”).
Bottom-Pressure Versus Altimetry Derived Tides
The first and third rows of Fig. 12 display diurnal and semidiurnal tidal amplitudes,
A, and phases, í µí¼, from Table 6 of the five BPRs in MC. These are the amplitude
and phases of an equivalent surface elevation field computed from the BPRs which
are here presented in terms of the real and imaginary components A(cos í µí¼, sin í µí¼) of
the complex vectors A exp(ií µí¼). Similar ‘harmonic vectors’, obtained from satellite
altimetry (OTIS), are shown in the second and fourth rows.
The comparison between BPRs and altimetry (OTIS) vectors in the Mozambique Channel, where tides are large, is excellent, especially for the semidiurnal
components (last two rows). The difference vectors are O (5%) in magnitude compared to those of the BPRs, for which reason, in section “Deep Versus Mid-depth