

Deep-Ocean Tides in the South-West Indian Ocean . . .
165
0
20
40
60
Amp. (cm)
N2
0
90
180
270
360
Phase (
◦
)
N2
0
50
100
150
Amp. (cm)
M2
0
90
180
270
360
Phase (
◦
)
M2
0
20
40
60
Amp. (cm)
S2
0
90
180
270
360
Phase (
◦
)
S2
06/11 08/11 10/11 12/11 02/12 04/12 06/12 08/12 10/12
0
20
40
Amp. (cm)
K2
Center Time
06/11 08/11 10/11 12/11 02/12 04/12 06/12 08/12 10/12
0
90
180
270
360
Phase (
◦
)
Center Time
K2
EMC1−0500 (13 mab)
EMC2−0500 (1100 mab)
EMC3−2600 (13 mab)
EMC4−0500 (3300 mab)
EMC5−0500 (3500 mab)
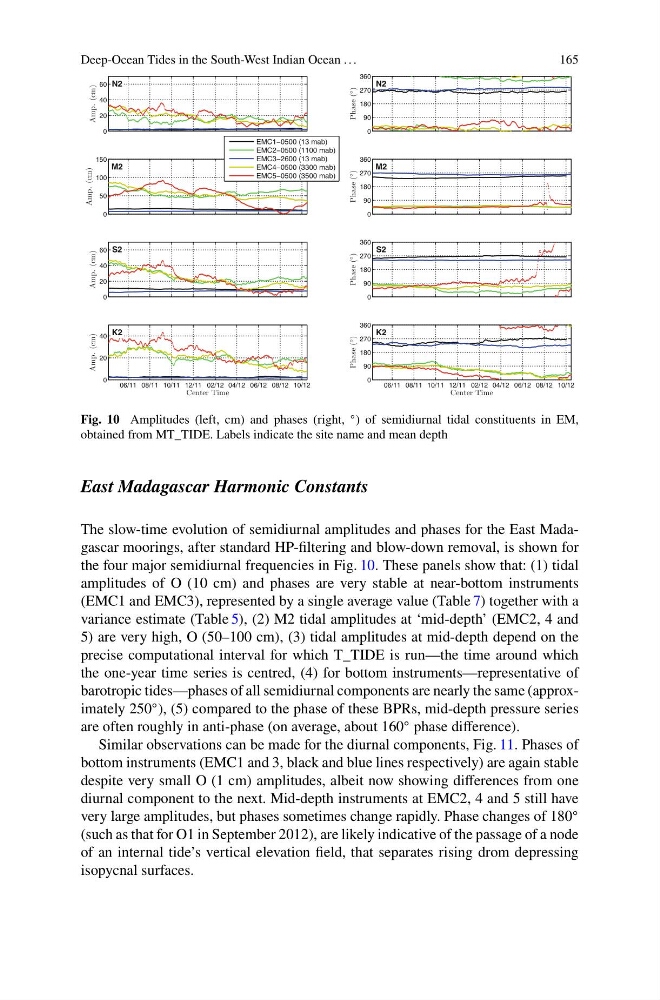
Fig. 10 Amplitudes (left, cm) and phases (right,
◦ ) of semidiurnal tidal constituents in EM,
obtained from MT_TIDE. Labels indicate the site name and mean depth
East Madagascar Harmonic Constants
The slow-time evolution of semidiurnal amplitudes and phases for the East Madagascar moorings, after standard HP-filtering and blow-down removal, is shown for
the four major semidiurnal frequencies in Fig. 10. These panels show that: (1) tidal
amplitudes of O (10 cm) and phases are very stable at near-bottom instruments
(EMC1 and EMC3), represented by a single average value (Table 7) together with a
variance estimate (Table 5), (2) M2 tidal amplitudes at ‘mid-depth’ (EMC2, 4 and
5) are very high, O (50–100 cm), (3) tidal amplitudes at mid-depth depend on the
precise computational interval for which T_TIDE is run—the time around which
the one-year time series is centred, (4) for bottom instruments—representative of
barotropic tides—phases of all semidiurnal components are nearly the same (approximately 250
◦ ), (5) compared to the phase of these BPRs, mid-depth pressure series
are often roughly in anti-phase (on average, about 160
◦ phase difference).
Similar observations can be made for the diurnal components, Fig. 11. Phases of
bottom instruments (EMC1 and 3, black and blue lines respectively) are again stable
despite very small O (1 cm) amplitudes, albeit now showing differences from one
diurnal component to the next. Mid-depth instruments at EMC2, 4 and 5 still have
very large amplitudes, but phases sometimes change rapidly. Phase changes of 180
◦
(such as that for O1 in September 2012), are likely indicative of the passage of a node
of an internal tide’s vertical elevation field, that separates rising drom depressing
isopycnal surfaces.
165
0
20
40
60
Amp. (cm)
N2
0
90
180
270
360
Phase (
◦
)
N2
0
50
100
150
Amp. (cm)
M2
0
90
180
270
360
Phase (
◦
)
M2
0
20
40
60
Amp. (cm)
S2
0
90
180
270
360
Phase (
◦
)
S2
06/11 08/11 10/11 12/11 02/12 04/12 06/12 08/12 10/12
0
20
40
Amp. (cm)
K2
Center Time
06/11 08/11 10/11 12/11 02/12 04/12 06/12 08/12 10/12
0
90
180
270
360
Phase (
◦
)
Center Time
K2
EMC1−0500 (13 mab)
EMC2−0500 (1100 mab)
EMC3−2600 (13 mab)
EMC4−0500 (3300 mab)
EMC5−0500 (3500 mab)
Fig. 10 Amplitudes (left, cm) and phases (right,
◦ ) of semidiurnal tidal constituents in EM,
obtained from MT_TIDE. Labels indicate the site name and mean depth
East Madagascar Harmonic Constants
The slow-time evolution of semidiurnal amplitudes and phases for the East Madagascar moorings, after standard HP-filtering and blow-down removal, is shown for
the four major semidiurnal frequencies in Fig. 10. These panels show that: (1) tidal
amplitudes of O (10 cm) and phases are very stable at near-bottom instruments
(EMC1 and EMC3), represented by a single average value (Table 7) together with a
variance estimate (Table 5), (2) M2 tidal amplitudes at ‘mid-depth’ (EMC2, 4 and
5) are very high, O (50–100 cm), (3) tidal amplitudes at mid-depth depend on the
precise computational interval for which T_TIDE is run—the time around which
the one-year time series is centred, (4) for bottom instruments—representative of
barotropic tides—phases of all semidiurnal components are nearly the same (approximately 250
◦ ), (5) compared to the phase of these BPRs, mid-depth pressure series
are often roughly in anti-phase (on average, about 160
◦ phase difference).
Similar observations can be made for the diurnal components, Fig. 11. Phases of
bottom instruments (EMC1 and 3, black and blue lines respectively) are again stable
despite very small O (1 cm) amplitudes, albeit now showing differences from one
diurnal component to the next. Mid-depth instruments at EMC2, 4 and 5 still have
very large amplitudes, but phases sometimes change rapidly. Phase changes of 180
◦
(such as that for O1 in September 2012), are likely indicative of the passage of a node
of an internal tide’s vertical elevation field, that separates rising drom depressing
isopycnal surfaces.