

160
L. R. M. Maas et al.
−2
0
2
Displ. (m)
Displ. (m)
Displ. (m)
Displ. (m)
EMC1-0500 (∼13 mab)
−100
0
100
200
EMC2-0500 (∼1100 mab)
−2
0
2 EMC3-2600 (∼13 mab)
−100
0
100
200
EMC4-0500 (∼3300 mab)
02/2011
06/2011
10/2011
02/2012
06/2012
10/2012
02/2013
EMC5-0500 (∼3500 mab)
Displ. (m)
−100
0
100
200
(a)
(b)
(c)
(d)
(e)
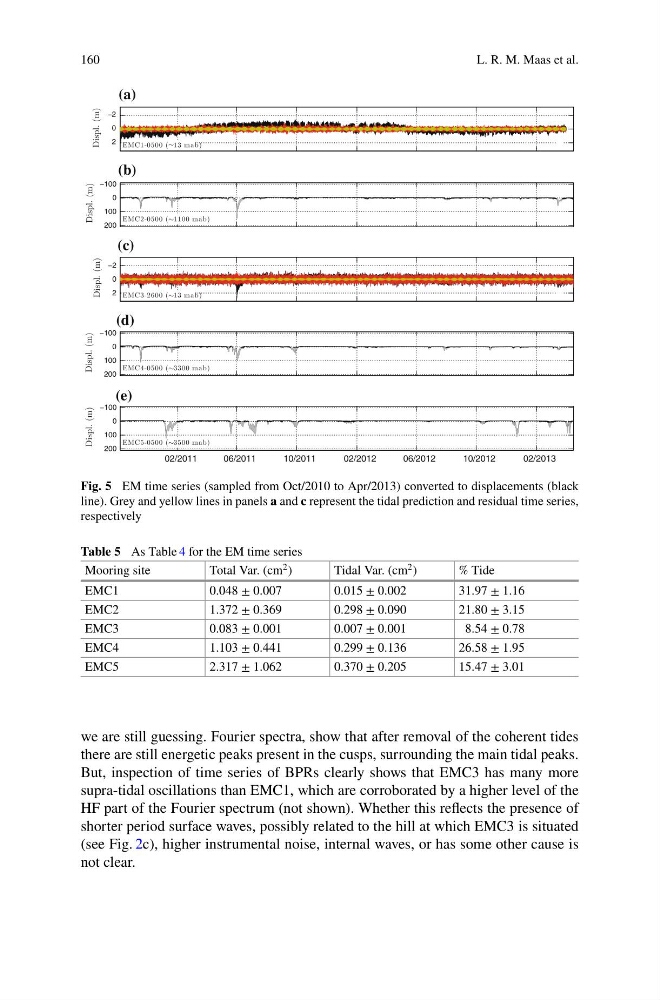
Fig. 5 EM time series (sampled from Oct/2010 to Apr/2013) converted to displacements (black
line). Grey and yellow lines in panels a and c represent the tidal prediction and residual time series,
respectively
Table 5 As Table 4 for the EM time series
Mooring site
Total Var. (cm 2 )
Tidal Var. (cm 2 )
% Tide
EMC1
0.048 ± 0.007
0.015 ± 0.002
31.97 ± 1.16
EMC2
1.372 ± 0.369
0.298 ± 0.090
21.80 ± 3.15
EMC3
0.083 ± 0.001
0.007 ± 0.001
8.54 ± 0.78
EMC4
1.103 ± 0.441
0.299 ± 0.136
26.58 ± 1.95
EMC5
2.317 ± 1.062
0.370 ± 0.205
15.47 ± 3.01
we are still guessing. Fourier spectra, show that after removal of the coherent tides
there are still energetic peaks present in the cusps, surrounding the main tidal peaks.
But, inspection of time series of BPRs clearly shows that EMC3 has many more
supra-tidal oscillations than EMC1, which are corroborated by a higher level of the
HF part of the Fourier spectrum (not shown). Whether this reflects the presence of
shorter period surface waves, possibly related to the hill at which EMC3 is situated
(see Fig. 2c), higher instrumental noise, internal waves, or has some other cause is
not clear.
L. R. M. Maas et al.
−2
0
2
Displ. (m)
Displ. (m)
Displ. (m)
Displ. (m)
EMC1-0500 (∼13 mab)
−100
0
100
200
EMC2-0500 (∼1100 mab)
−2
0
2 EMC3-2600 (∼13 mab)
−100
0
100
200
EMC4-0500 (∼3300 mab)
02/2011
06/2011
10/2011
02/2012
06/2012
10/2012
02/2013
EMC5-0500 (∼3500 mab)
Displ. (m)
−100
0
100
200
(a)
(b)
(c)
(d)
(e)
Fig. 5 EM time series (sampled from Oct/2010 to Apr/2013) converted to displacements (black
line). Grey and yellow lines in panels a and c represent the tidal prediction and residual time series,
respectively
Table 5 As Table 4 for the EM time series
Mooring site
Total Var. (cm 2 )
Tidal Var. (cm 2 )
% Tide
EMC1
0.048 ± 0.007
0.015 ± 0.002
31.97 ± 1.16
EMC2
1.372 ± 0.369
0.298 ± 0.090
21.80 ± 3.15
EMC3
0.083 ± 0.001
0.007 ± 0.001
8.54 ± 0.78
EMC4
1.103 ± 0.441
0.299 ± 0.136
26.58 ± 1.95
EMC5
2.317 ± 1.062
0.370 ± 0.205
15.47 ± 3.01
we are still guessing. Fourier spectra, show that after removal of the coherent tides
there are still energetic peaks present in the cusps, surrounding the main tidal peaks.
But, inspection of time series of BPRs clearly shows that EMC3 has many more
supra-tidal oscillations than EMC1, which are corroborated by a higher level of the
HF part of the Fourier spectrum (not shown). Whether this reflects the presence of
shorter period surface waves, possibly related to the hill at which EMC3 is situated
(see Fig. 2c), higher instrumental noise, internal waves, or has some other cause is
not clear.