

Deep-Ocean Tides in the South-West Indian Ocean . . .
149
50
◦ S
40
◦ S
30
◦ S
20
◦ S
10
◦ S
0
◦
10
◦ N
30
◦ E
40
◦ E
50
◦ E
60
◦ E
70
◦ E
80
◦ E
90
◦ E
100
◦ E
110
◦ E
120
◦ E
M2
Africa
M ad ag as ca r
M o z a m b iq u e C h a n n e l
3 0
45
4 5
4 5
6 0
7 5
90
5
0
1
120
135
1 5 0
1 6 5
18
0
19
5
2
1
0
2 2 5
240
2 5 5
27 0
30 0
3 3 0
3 4 5
1 5
30
4 5
6 0
1 0 5
13 5
150
1 6 5
1 8 0
19 5
2 2 5
24 0
25 5
27 0
60
45
15
270
2 8 5
3 0 0
3 1 5
330
45
30
15
3 3 0
3 0 0
27 0
240
25 5
22 5
2 1 0
1 9 5 1 8 0
165
13 5 1 0 5
259
260
260
2 5 9
26 1
2 6 1
0
1 5
3 0
4 5
6 0
7 5
9 0
1 0 5
1 2 0
Amplitude(cm)
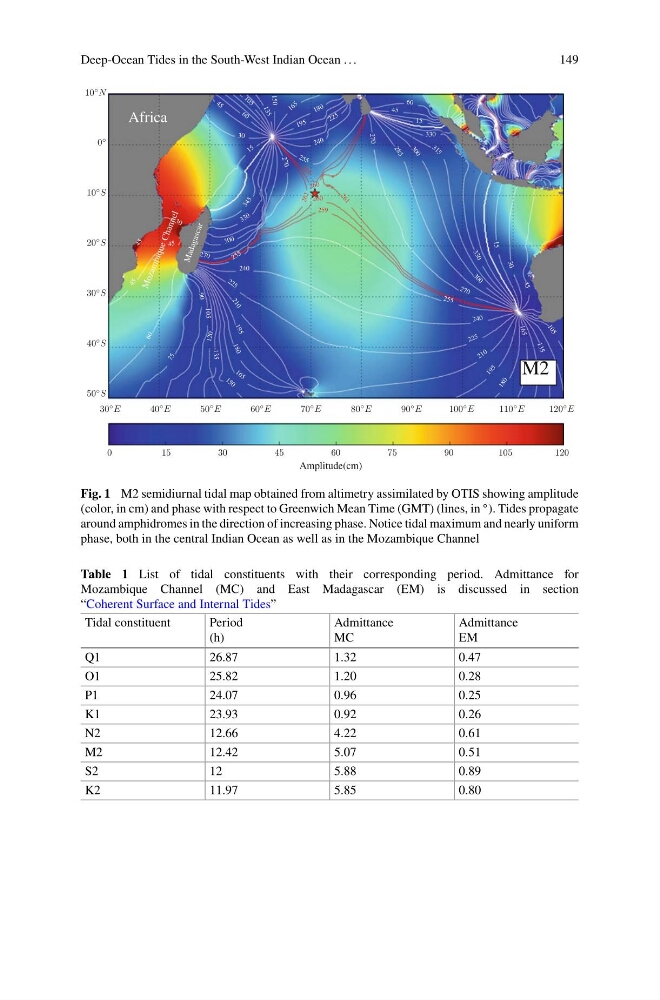
Fig. 1 M2 semidiurnal tidal map obtained from altimetry assimilated by OTIS showing amplitude
(color, in cm) and phase with respect to Greenwich Mean Time (GMT) (lines, in ◦ ). Tides propagate
around amphidromes in the direction of increasing phase. Notice tidal maximum and nearly uniform
phase, both in the central Indian Ocean as well as in the Mozambique Channel
Table 1 List of tidal constituents with their corresponding period. Admittance for
Mozambique Channel (MC) and East Madagascar (EM) is discussed in section
“Coherent Surface and Internal Tides”
Tidal constituent
Period
(h)
Admittance
MC
Admittance
EM
Q1
26.87
1.32
0.47
O1
25.82
1.20
0.28
P1
24.07
0.96
0.25
K1
23.93
0.92
0.26
N2
12.66
4.22
0.61
M2
12.42
5.07
0.51
S2
12
5.88
0.89
K2
11.97
5.85
0.80
149
50
◦ S
40
◦ S
30
◦ S
20
◦ S
10
◦ S
0
◦
10
◦ N
30
◦ E
40
◦ E
50
◦ E
60
◦ E
70
◦ E
80
◦ E
90
◦ E
100
◦ E
110
◦ E
120
◦ E
M2
Africa
M ad ag as ca r
M o z a m b iq u e C h a n n e l
3 0
45
4 5
4 5
6 0
7 5
90
5
0
1
120
135
1 5 0
1 6 5
18
0
19
5
2
1
0
2 2 5
240
2 5 5
27 0
30 0
3 3 0
3 4 5
1 5
30
4 5
6 0
1 0 5
13 5
150
1 6 5
1 8 0
19 5
2 2 5
24 0
25 5
27 0
60
45
15
270
2 8 5
3 0 0
3 1 5
330
45
30
15
3 3 0
3 0 0
27 0
240
25 5
22 5
2 1 0
1 9 5 1 8 0
165
13 5 1 0 5
259
260
260
2 5 9
26 1
2 6 1
0
1 5
3 0
4 5
6 0
7 5
9 0
1 0 5
1 2 0
Amplitude(cm)
Fig. 1 M2 semidiurnal tidal map obtained from altimetry assimilated by OTIS showing amplitude
(color, in cm) and phase with respect to Greenwich Mean Time (GMT) (lines, in ◦ ). Tides propagate
around amphidromes in the direction of increasing phase. Notice tidal maximum and nearly uniform
phase, both in the central Indian Ocean as well as in the Mozambique Channel
Table 1 List of tidal constituents with their corresponding period. Admittance for
Mozambique Channel (MC) and East Madagascar (EM) is discussed in section
“Coherent Surface and Internal Tides”
Tidal constituent
Period
(h)
Admittance
MC
Admittance
EM
Q1
26.87
1.32
0.47
O1
25.82
1.20
0.28
P1
24.07
0.96
0.25
K1
23.93
0.92
0.26
N2
12.66
4.22
0.61
M2
12.42
5.07
0.51
S2
12
5.88
0.89
K2
11.97
5.85
0.80