

THE NEAR-SURFACE LAYER OF THE OCEAN
2.1 Phenomenology
2.1.1 Viscous sublayer
Viscous sublayers develop on both sides of the air-sea interface. To our
knowledge, direct measurements of the viscous sublayer either from the
oceanic or atmospheric side of the air-sea interface have never been made
under real oceanic conditions. Information about the aqueous viscous
sublayer of the ocean has been mainly obtained from theoretical
considerations (for instance, Csanady, 1978) or laboratory studies (McLeish
and Putland, 1975; Wu, 1975; and others).
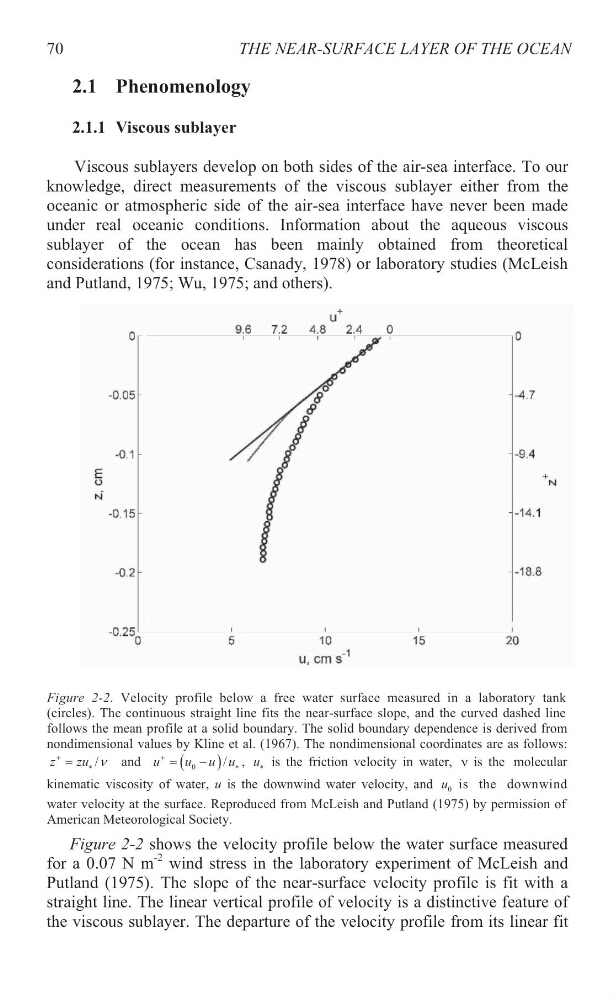
Figure 2-2 shows the velocity profile below the water surface measured
for a 0.07 N m
-2 wind stress in the laboratory experiment of McLeish and
Putland (1975). The slope of the near-surface velocity profile is fit with a
straight line. The linear vertical profile of velocity is a distinctive feature of
the viscous sublayer. The departure of the velocity profile from its linear fit
70
Figure 2-2. Velocity profile below a free water surface measured in a laboratory tank
(circles). The continuous straight line fits the near-surface slope, and the curved dashed line
follows the mean profile at a solid boundary. The solid boundary dependence is derived from
nondimensional values by Kline et al. (1967). The nondimensional coordinates are as follows:
/
z
zu Q
and
0
/
u
u u u
, u is the friction velocity in water, Q is the molecular
kinematic viscosity of water, u is the downwind water velocity, and 0
u is the downwind
water velocity at the surface. Reproduced from McLeish and Putland (1975) by permission of
American Meteorological Society.
2.1 Phenomenology
2.1.1 Viscous sublayer
Viscous sublayers develop on both sides of the air-sea interface. To our
knowledge, direct measurements of the viscous sublayer either from the
oceanic or atmospheric side of the air-sea interface have never been made
under real oceanic conditions. Information about the aqueous viscous
sublayer of the ocean has been mainly obtained from theoretical
considerations (for instance, Csanady, 1978) or laboratory studies (McLeish
and Putland, 1975; Wu, 1975; and others).
Figure 2-2 shows the velocity profile below the water surface measured
for a 0.07 N m
-2 wind stress in the laboratory experiment of McLeish and
Putland (1975). The slope of the near-surface velocity profile is fit with a
straight line. The linear vertical profile of velocity is a distinctive feature of
the viscous sublayer. The departure of the velocity profile from its linear fit
70
Figure 2-2. Velocity profile below a free water surface measured in a laboratory tank
(circles). The continuous straight line fits the near-surface slope, and the curved dashed line
follows the mean profile at a solid boundary. The solid boundary dependence is derived from
nondimensional values by Kline et al. (1967). The nondimensional coordinates are as follows:
/
z
zu Q
and
0
/
u
u u u
, u is the friction velocity in water, Q is the molecular
kinematic viscosity of water, u is the downwind water velocity, and 0
u is the downwind
water velocity at the surface. Reproduced from McLeish and Putland (1975) by permission of
American Meteorological Society.