

Chapter 7: APPLICATIONS
relationships are easy to apply, they lead to outliers and also may
overestimate rainfall when the rain contains relatively more large drops.
Figure 7-14 shows a comparison of wind speed observations from the
buoy anemometer and from the acoustic data. The acoustic wind speed is in
reasonable agreement with the anemometer record, although the acoustic
estimates appear to be biased high above 7 m s
-1 .
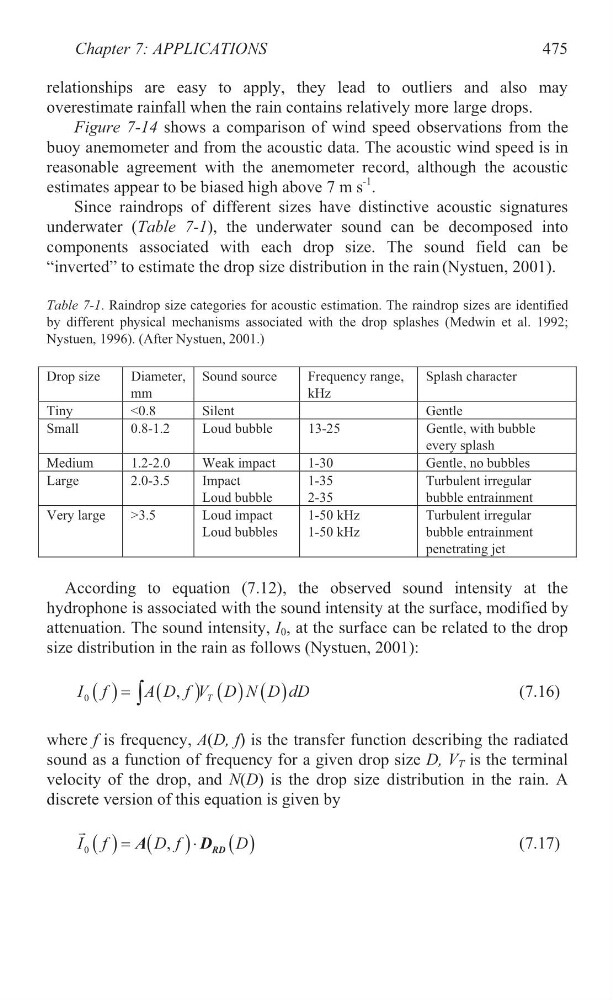
Since raindrops of different sizes have distinctive acoustic signatures
underwater (Table 7-1), the underwater sound can be decomposed into
components associated with each drop size. The sound field can be
“inverted” to estimate the drop size distribution in the rain (Nystuen, 2001).
Table 7-1. Raindrop size categories for acoustic estimation. The raindrop sizes are identified
by different physical mechanisms associated with the drop splashes (Medwin et al. 1992;
Nystuen, 1996). (After Nystuen, 2001.)
Drop size
Diameter,
mm
Sound source
Frequency range,
kHz
Splash character
Tiny
<0.8
Silent
Gentle
Small
0.8-1.2
Loud bubble
13-25
Gentle, with bubble
every splash
Medium
1.2-2.0
Weak impact
1-30
Gentle, no bubbles
Large
2.0-3.5
Impact
Loud bubble
1-35
2-35
Turbulent irregular
bubble entrainment
Very large
>3.5
Loud impact
Loud bubbles
1-50 kHz
1-50 kHz
Turbulent irregular
bubble entrainment
penetrating jet
According to equation (7.12), the observed sound intensity at the
hydrophone is associated with the sound intensity at the surface, modified by
attenuation. The sound intensity, I 0 , at the surface can be related to the drop
size distribution in the rain as follows (Nystuen, 2001):
0
,
T
I f
A D f V D N D dD
³
(7.16)
where f is frequency, A(D, f) is the transfer function describing the radiated
sound as a function of frequency for a given drop size D, V T is the terminal
velocity of the drop, and N(D) is the drop size distribution in the rain. A
discrete version of this equation is given by
0
,
RD
I f
A D f D D
G
(7.17)
475
relationships are easy to apply, they lead to outliers and also may
overestimate rainfall when the rain contains relatively more large drops.
Figure 7-14 shows a comparison of wind speed observations from the
buoy anemometer and from the acoustic data. The acoustic wind speed is in
reasonable agreement with the anemometer record, although the acoustic
estimates appear to be biased high above 7 m s
-1 .
Since raindrops of different sizes have distinctive acoustic signatures
underwater (Table 7-1), the underwater sound can be decomposed into
components associated with each drop size. The sound field can be
“inverted” to estimate the drop size distribution in the rain (Nystuen, 2001).
Table 7-1. Raindrop size categories for acoustic estimation. The raindrop sizes are identified
by different physical mechanisms associated with the drop splashes (Medwin et al. 1992;
Nystuen, 1996). (After Nystuen, 2001.)
Drop size
Diameter,
mm
Sound source
Frequency range,
kHz
Splash character
Tiny
<0.8
Silent
Gentle
Small
0.8-1.2
Loud bubble
13-25
Gentle, with bubble
every splash
Medium
1.2-2.0
Weak impact
1-30
Gentle, no bubbles
Large
2.0-3.5
Impact
Loud bubble
1-35
2-35
Turbulent irregular
bubble entrainment
Very large
>3.5
Loud impact
Loud bubbles
1-50 kHz
1-50 kHz
Turbulent irregular
bubble entrainment
penetrating jet
According to equation (7.12), the observed sound intensity at the
hydrophone is associated with the sound intensity at the surface, modified by
attenuation. The sound intensity, I 0 , at the surface can be related to the drop
size distribution in the rain as follows (Nystuen, 2001):
0
,
T
I f
A D f V D N D dD
³
(7.16)
where f is frequency, A(D, f) is the transfer function describing the radiated
sound as a function of frequency for a given drop size D, V T is the terminal
velocity of the drop, and N(D) is the drop size distribution in the rain. A
discrete version of this equation is given by
0
,
RD
I f
A D f D D
G
(7.17)
475