

Chapter 7: APPLICATIONS
the analysis. For instance, appreciable salinity difference in the near-surface
layer of the ocean can develop due to rainfalls (Sections 2.5 and 4.1).
Knowledge of the precipitation distribution will be helpful for the
interpretation of remotely sensed salinity (as well as for many other issues).
The first specialized satellite for precipitation measurements was the
Tropical Rainfall Mapping Mission (TRMM), a joint research project
445
Figure 7-3. Comparison of salinity fields obtained from (a) the thermosalinograph data and (b)
from an airborne remote sensing instrument (ESTAR). Reproduced from Le Vine et al. (1998)
by permission from American Meteorological Society.
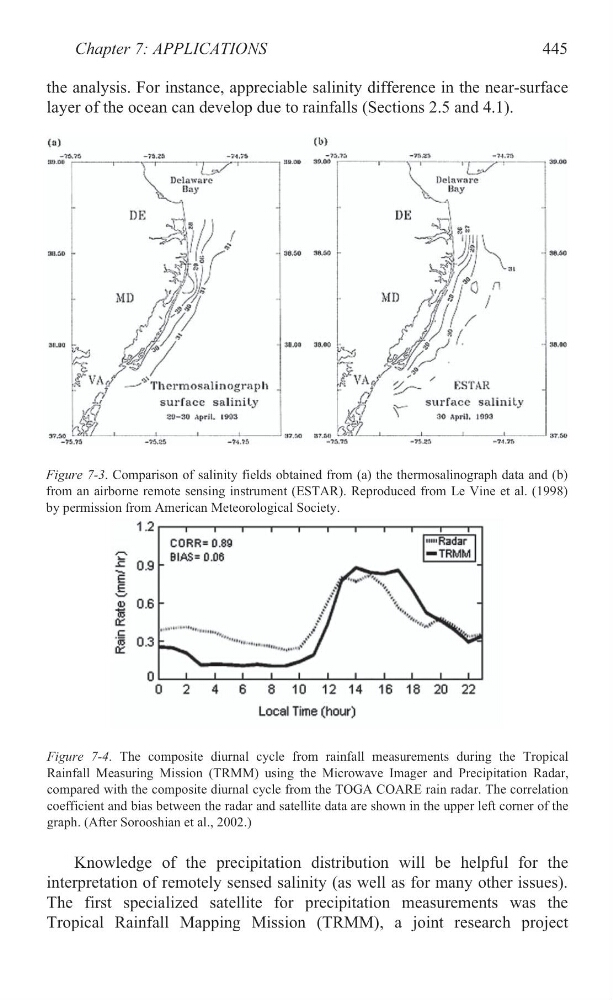
Figure 7-4. The composite diurnal cycle from rainfall measurements during the Tropical
Rainfall Measuring Mission (TRMM) using the Microwave Imager and Precipitation Radar,
compared with the composite diurnal cycle from the TOGA COARE rain radar. The correlation
coefficient and bias between the radar and satellite data are shown in the upper left corner of the
graph. (After Sorooshian et al., 2002.)
the analysis. For instance, appreciable salinity difference in the near-surface
layer of the ocean can develop due to rainfalls (Sections 2.5 and 4.1).
Knowledge of the precipitation distribution will be helpful for the
interpretation of remotely sensed salinity (as well as for many other issues).
The first specialized satellite for precipitation measurements was the
Tropical Rainfall Mapping Mission (TRMM), a joint research project
445
Figure 7-3. Comparison of salinity fields obtained from (a) the thermosalinograph data and (b)
from an airborne remote sensing instrument (ESTAR). Reproduced from Le Vine et al. (1998)
by permission from American Meteorological Society.
Figure 7-4. The composite diurnal cycle from rainfall measurements during the Tropical
Rainfall Measuring Mission (TRMM) using the Microwave Imager and Precipitation Radar,
compared with the composite diurnal cycle from the TOGA COARE rain radar. The correlation
coefficient and bias between the radar and satellite data are shown in the upper left corner of the
graph. (After Sorooshian et al., 2002.)