

THE NEAR-SURFACE LAYER OF THE OCEAN
spectrum. Spectrum (6.9) should be used with parameterization formulas
(6.2) and (6.3).
Remarkably, equation (6.9) does not contain H as a determining
parameter. (From Chapter 3 the reader knows how difficult would be to
measure the dissipation rate in a breaking wave.)
Figure 6-5 shows bubble size distributions acquired in the Gulf of
Mexico by Farmer et al. (1998) at depths 0.7 m, 1.9 m, and 3.5 m. The
bubble density decreases with depth. The most significant drop of the bubble
population is observed between 0.7 m and 1.9 m depths for large bubbles (r
> 200 Pm). A plausible explanation is that the 0.7 m depth is within the
wave-stirred layer, while the observations at 1.9 m depth are outside this
layer.
The spectra shown in Figure 6-5 are averages over a sufficiently large
time period (30 minutes). Since this time period included different types of
wave-breaking events, bimodal spectral structures (like those shown in
Figure 6-4) could not be revealed.
6.1.4 Bubble dispersion and diffusion
A bubble plume injected in the near-surface layer of the ocean during a
wave-breaking event is subject to dispersion and turbulent diffusion. Larger
bubbles rise to the surface within a few seconds, forming the whitecaps.
Wave breaking also leaves numerous smaller bubbles that can persist for
minutes.
Garrettson (1973) derived an equation governing the size distribution N
of a cloud of bubbles at depth z. Thorpe (1982) simplified this equation by
considering the cloud composed of small bubbles of a single gas (for
instance, nitrogen) and of almost equal size. Ignoring acceleration and
volume source terms (but retaining the dissolution term), and assuming
horizontal isotropy transport equation (1.12) in application to bubbles
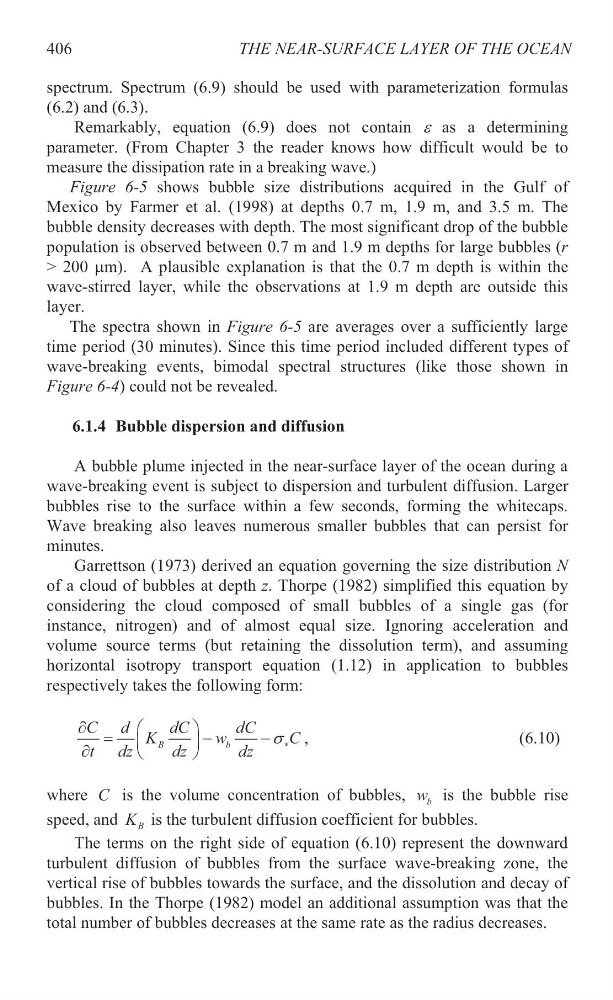
respectively takes the following form:
B
b
C d
dC
dC
K
w
C
t dz
dz
dz
V
w
§
·
¨
¸
w
©
¹
,
(6.10)
where C is the volume concentration of bubbles, b
w is the bubble rise
speed, and B
K is the turbulent diffusion coefficient for bubbles.
The terms on the right side of equation (6.10) represent the downward
turbulent diffusion of bubbles from the surface wave-breaking zone, the
vertical rise of bubbles towards the surface, and the dissolution and decay of
bubbles. In the Thorpe (1982) model an additional assumption was that the
total number of bubbles decreases at the same rate as the radius decreases.
406
spectrum. Spectrum (6.9) should be used with parameterization formulas
(6.2) and (6.3).
Remarkably, equation (6.9) does not contain H as a determining
parameter. (From Chapter 3 the reader knows how difficult would be to
measure the dissipation rate in a breaking wave.)
Figure 6-5 shows bubble size distributions acquired in the Gulf of
Mexico by Farmer et al. (1998) at depths 0.7 m, 1.9 m, and 3.5 m. The
bubble density decreases with depth. The most significant drop of the bubble
population is observed between 0.7 m and 1.9 m depths for large bubbles (r
> 200 Pm). A plausible explanation is that the 0.7 m depth is within the
wave-stirred layer, while the observations at 1.9 m depth are outside this
layer.
The spectra shown in Figure 6-5 are averages over a sufficiently large
time period (30 minutes). Since this time period included different types of
wave-breaking events, bimodal spectral structures (like those shown in
Figure 6-4) could not be revealed.
6.1.4 Bubble dispersion and diffusion
A bubble plume injected in the near-surface layer of the ocean during a
wave-breaking event is subject to dispersion and turbulent diffusion. Larger
bubbles rise to the surface within a few seconds, forming the whitecaps.
Wave breaking also leaves numerous smaller bubbles that can persist for
minutes.
Garrettson (1973) derived an equation governing the size distribution N
of a cloud of bubbles at depth z. Thorpe (1982) simplified this equation by
considering the cloud composed of small bubbles of a single gas (for
instance, nitrogen) and of almost equal size. Ignoring acceleration and
volume source terms (but retaining the dissolution term), and assuming
horizontal isotropy transport equation (1.12) in application to bubbles
respectively takes the following form:
B
b
C d
dC
dC
K
w
C
t dz
dz
dz
V
w
§
·
¨
¸
w
©
¹
,
(6.10)
where C is the volume concentration of bubbles, b
w is the bubble rise
speed, and B
K is the turbulent diffusion coefficient for bubbles.
The terms on the right side of equation (6.10) represent the downward
turbulent diffusion of bubbles from the surface wave-breaking zone, the
vertical rise of bubbles towards the surface, and the dissolution and decay of
bubbles. In the Thorpe (1982) model an additional assumption was that the
total number of bubbles decreases at the same rate as the radius decreases.
406