

THE NEAR-SURFACE LAYER OF THE OCEAN
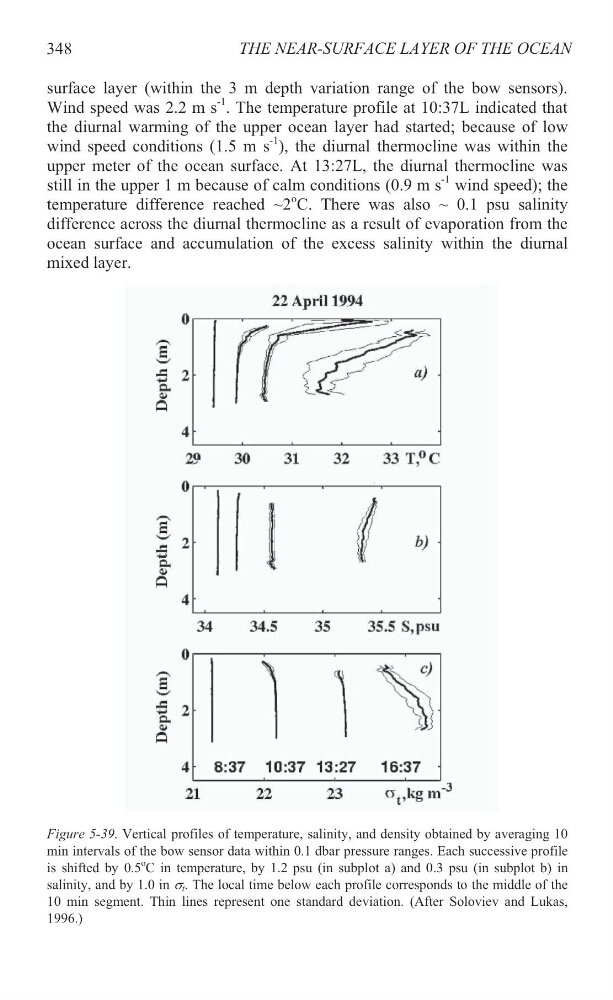
surface layer (within the 3 m depth variation range of the bow sensors).
Wind speed was 2.2 m s
-1 . The temperature profile at 10:37L indicated that
the diurnal warming of the upper ocean layer had started; because of low
wind speed conditions (1.5 m s
-1 ), the diurnal thermocline was within the
upper meter of the ocean surface. At 13:27L, the diurnal thermocline was
still in the upper 1 m because of calm conditions (0.9 m s
-1 wind speed); the
temperature difference reached ~2
o C. There was also ~ 0.1 psu salinity
difference across the diurnal thermocline as a result of evaporation from the
ocean surface and accumulation of the excess salinity within the diurnal
mixed layer.
Figure 5-39. Vertical profiles of temperature, salinity, and density obtained by averaging 10
min intervals of the bow sensor data within 0.1 dbar pressure ranges. Each successive profile
is shifted by 0.5
o C in temperature, by 1.2 psu (in subplot a) and 0.3 psu (in subplot b) in
salinity, and by 1.0 in V t . The local time below each profile corresponds to the middle of the
10 min segment. Thin lines represent one standard deviation. (After Soloviev and Lukas,
1996.)
348
surface layer (within the 3 m depth variation range of the bow sensors).
Wind speed was 2.2 m s
-1 . The temperature profile at 10:37L indicated that
the diurnal warming of the upper ocean layer had started; because of low
wind speed conditions (1.5 m s
-1 ), the diurnal thermocline was within the
upper meter of the ocean surface. At 13:27L, the diurnal thermocline was
still in the upper 1 m because of calm conditions (0.9 m s
-1 wind speed); the
temperature difference reached ~2
o C. There was also ~ 0.1 psu salinity
difference across the diurnal thermocline as a result of evaporation from the
ocean surface and accumulation of the excess salinity within the diurnal
mixed layer.
Figure 5-39. Vertical profiles of temperature, salinity, and density obtained by averaging 10
min intervals of the bow sensor data within 0.1 dbar pressure ranges. Each successive profile
is shifted by 0.5
o C in temperature, by 1.2 psu (in subplot a) and 0.3 psu (in subplot b) in
salinity, and by 1.0 in V t . The local time below each profile corresponds to the middle of the
10 min segment. Thin lines represent one standard deviation. (After Soloviev and Lukas,
1996.)
348