

THE NEAR-SURFACE LAYER OF THE OCEAN
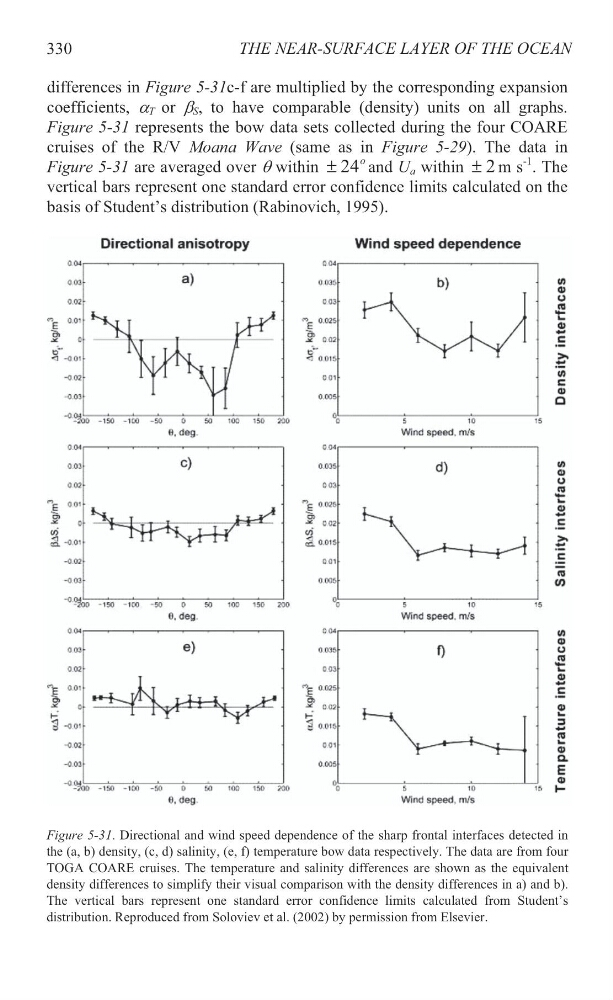
differences in Figure 5-31c-f are multiplied by the corresponding expansion
coefficients, D T or E S , to have comparable (density) units on all graphs.
Figure 5-31 represents the bow data sets collected during the four COARE
cruises of the R/V Moana Wave (same as in Figure 5-29). The data in
Figure 5-31 are averaged over T within
o
24
r
and U a within 2
r m s
-1 . The
vertical bars represent one standard error confidence limits calculated on the
basis of Student’s distribution (Rabinovich, 1995).
330
Figure 5-31. Directional and wind speed dependence of the sharp frontal interfaces detected in
the (a, b) density, (c, d) salinity, (e, f) temperature bow data respectively. The data are from four
TOGA COARE cruises. The temperature and salinity differences are shown as the equivalent
density differences to simplify their visual comparison with the density differences in a) and b).
The vertical bars represent one standard error confidence limits calculated from Student’s
distribution. Reproduced from Soloviev et al. (2002) by permission from Elsevier.
differences in Figure 5-31c-f are multiplied by the corresponding expansion
coefficients, D T or E S , to have comparable (density) units on all graphs.
Figure 5-31 represents the bow data sets collected during the four COARE
cruises of the R/V Moana Wave (same as in Figure 5-29). The data in
Figure 5-31 are averaged over T within
o
24
r
and U a within 2
r m s
-1 . The
vertical bars represent one standard error confidence limits calculated on the
basis of Student’s distribution (Rabinovich, 1995).
330
Figure 5-31. Directional and wind speed dependence of the sharp frontal interfaces detected in
the (a, b) density, (c, d) salinity, (e, f) temperature bow data respectively. The data are from four
TOGA COARE cruises. The temperature and salinity differences are shown as the equivalent
density differences to simplify their visual comparison with the density differences in a) and b).
The vertical bars represent one standard error confidence limits calculated from Student’s
distribution. Reproduced from Soloviev et al. (2002) by permission from Elsevier.