

THE NEAR-SURFACE LAYER OF THE OCEAN
Figure 5-28 shows the individual intersections of the front on a high
resolution distance scale. Intersections 2, 4 and, 6 are plotted in the inverse
direction because of the reciprocal course of the ship at these intersections.
For intersections 5, 6, and 7, the horizontal scale is multiplied by 0.15, 0.5,
and 0.5 respectively to correct for the oblique angle of intersection with the
front. A feature of this front is that it is seen in the V t record only at
intersections 1, 2, and 3. For the intersections 4, 5, 6, and 7 the frontal
interface is almost compensated in the density field but is still seen in the T
and S records. The front shown in Figure 5-28 is of about one order of
magnitude wider than that shown in Figure 5-26. We ascribe this difference
to the wind stress direction opposing the buoyant spreading of the front in
the former case.
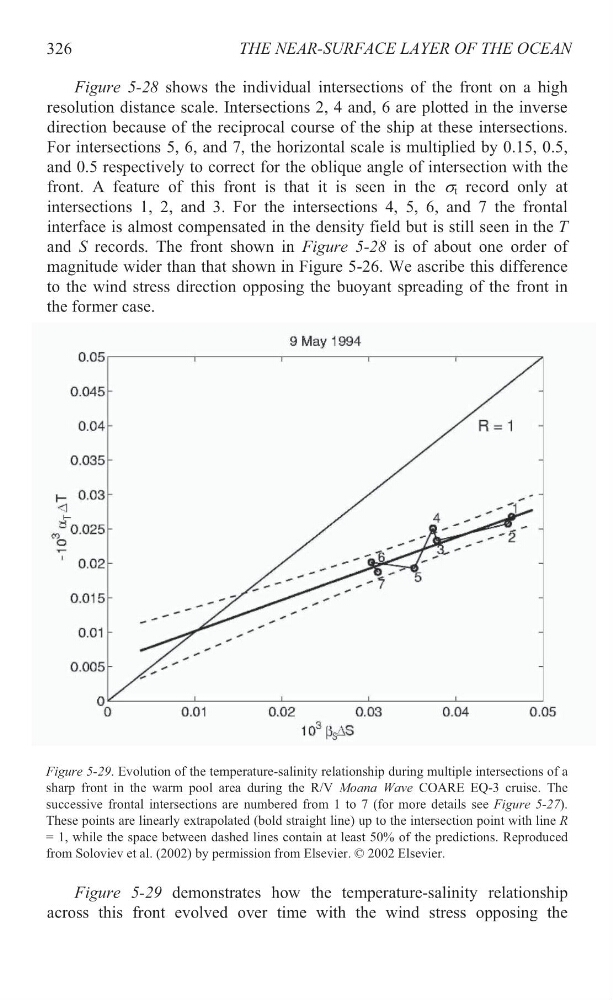
Figure 5-29 demonstrates how the temperature-salinity relationship
across this front evolved over time with the wind stress opposing the
326
Figure 5-29. Evolution of the temperature-salinity relationship during multiple intersections of a
sharp front in the warm pool area during the R/V Moana Wave COARE EQ-3 cruise. The
successive frontal intersections are numbered from 1 to 7 (for more details see Figure 5-27).
These points are linearly extrapolated (bold straight line) up to the intersection point with line R
= 1, while the space between dashed lines contain at least 50% of the predictions. Reproduced
from Soloviev et al. (2002) by permission from Elsevier. © 2002 Elsevier.
Figure 5-28 shows the individual intersections of the front on a high
resolution distance scale. Intersections 2, 4 and, 6 are plotted in the inverse
direction because of the reciprocal course of the ship at these intersections.
For intersections 5, 6, and 7, the horizontal scale is multiplied by 0.15, 0.5,
and 0.5 respectively to correct for the oblique angle of intersection with the
front. A feature of this front is that it is seen in the V t record only at
intersections 1, 2, and 3. For the intersections 4, 5, 6, and 7 the frontal
interface is almost compensated in the density field but is still seen in the T
and S records. The front shown in Figure 5-28 is of about one order of
magnitude wider than that shown in Figure 5-26. We ascribe this difference
to the wind stress direction opposing the buoyant spreading of the front in
the former case.
Figure 5-29 demonstrates how the temperature-salinity relationship
across this front evolved over time with the wind stress opposing the
326
Figure 5-29. Evolution of the temperature-salinity relationship during multiple intersections of a
sharp front in the warm pool area during the R/V Moana Wave COARE EQ-3 cruise. The
successive frontal intersections are numbered from 1 to 7 (for more details see Figure 5-27).
These points are linearly extrapolated (bold straight line) up to the intersection point with line R
= 1, while the space between dashed lines contain at least 50% of the predictions. Reproduced
from Soloviev et al. (2002) by permission from Elsevier. © 2002 Elsevier.