

THE NEAR-SURFACE LAYER OF THE OCEAN
Several factors complicate shipboard observations of the sharp frontal
interfaces. Such fronts are very localized in space; the moments of their
intersection are usually unknown in advance. For their study, high-resolution
measurements over a relatively long time period are therefore necessary.
There are no conventional techniques for such measurements. (Remember
that standard shipboard thermosalinographs usually don’t resolve features
with scales less than several hundred meters.) Moreover, the magnitude of
the cross-frontal difference in temperature (T) and salinity (S) is typically
only of the order of 0.01
o
C or psu. Such frontal interfaces may be strongly
masked at the surface by diurnal warming or precipitation effects in the nearsurface layer of the ocean. In measurements by moored sensors, the fronts
can be detected only for extreme situations, because the frequency range of
the signal from frontal passages substantially overlaps the frequency range
of the diurnal warming/precipitation variability. High-resolution towed
320
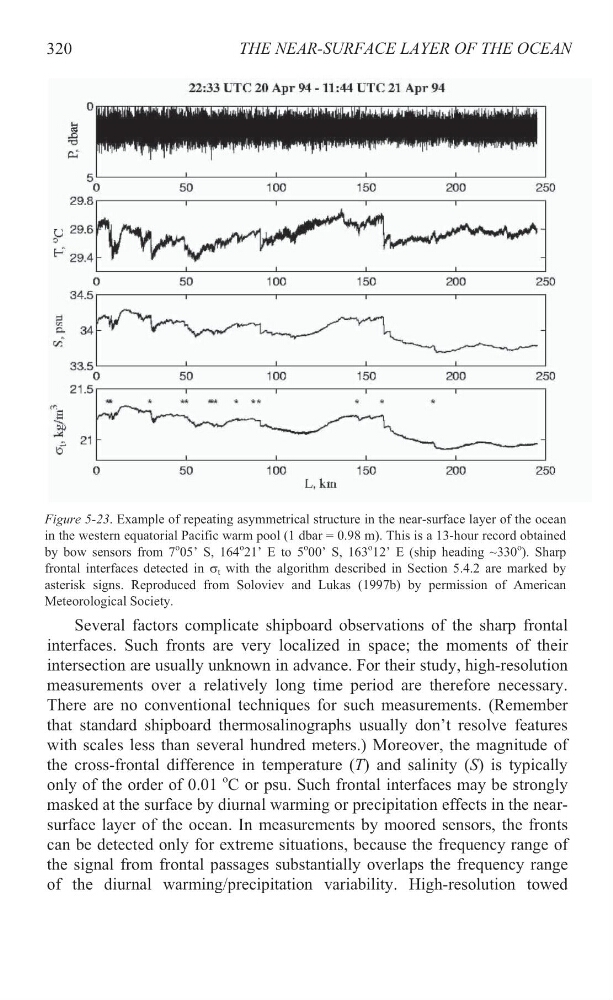
Figure 5-23. Example of repeating asymmetrical structure in the near-surface layer of the ocean
in the western equatorial Pacific warm pool (1 dbar = 0.98 m). This is a 13-hour record obtained
by bow sensors from 7
o 05’ S, 164
o 21’ E to 5
o 00’ S, 163
o 12’ E (ship heading ~330
o ). Sharp
frontal interfaces detected in V t with the algorithm described in Section 5.4.2 are marked by
asterisk signs. Reproduced from Soloviev and Lukas (1997b) by permission of American
Meteorological Society.
Several factors complicate shipboard observations of the sharp frontal
interfaces. Such fronts are very localized in space; the moments of their
intersection are usually unknown in advance. For their study, high-resolution
measurements over a relatively long time period are therefore necessary.
There are no conventional techniques for such measurements. (Remember
that standard shipboard thermosalinographs usually don’t resolve features
with scales less than several hundred meters.) Moreover, the magnitude of
the cross-frontal difference in temperature (T) and salinity (S) is typically
only of the order of 0.01
o
C or psu. Such frontal interfaces may be strongly
masked at the surface by diurnal warming or precipitation effects in the nearsurface layer of the ocean. In measurements by moored sensors, the fronts
can be detected only for extreme situations, because the frequency range of
the signal from frontal passages substantially overlaps the frequency range
of the diurnal warming/precipitation variability. High-resolution towed
320
Figure 5-23. Example of repeating asymmetrical structure in the near-surface layer of the ocean
in the western equatorial Pacific warm pool (1 dbar = 0.98 m). This is a 13-hour record obtained
by bow sensors from 7
o 05’ S, 164
o 21’ E to 5
o 00’ S, 163
o 12’ E (ship heading ~330
o ). Sharp
frontal interfaces detected in V t with the algorithm described in Section 5.4.2 are marked by
asterisk signs. Reproduced from Soloviev and Lukas (1997b) by permission of American
Meteorological Society.