

THE NEAR-SURFACE LAYER OF THE OCEAN
X X Figure 4-34X shows the results of a simulation of the diurnal cycle in the
western Pacific warm pool area with the transilient model. The vertical
resolution and the time step were 0.25 m and 15 s respectively. The vertical
profiles of temperature and salinity were initialized to be a constant in the
upper 20 m of the ocean, while the velocity profile was initialized with a
0.0004 sP
-1
Pshear
to ensure finite values of the Richardson number for the first
step of the simulation. The model was forced with the wind stress and
sensible and latent heat fluxes calculated with the TOGA COARE Version
2.5a bulk-flux algorithm. The net long-wave radiation flux was calculated
using the parameterization of Simpson and Paulson (1979).
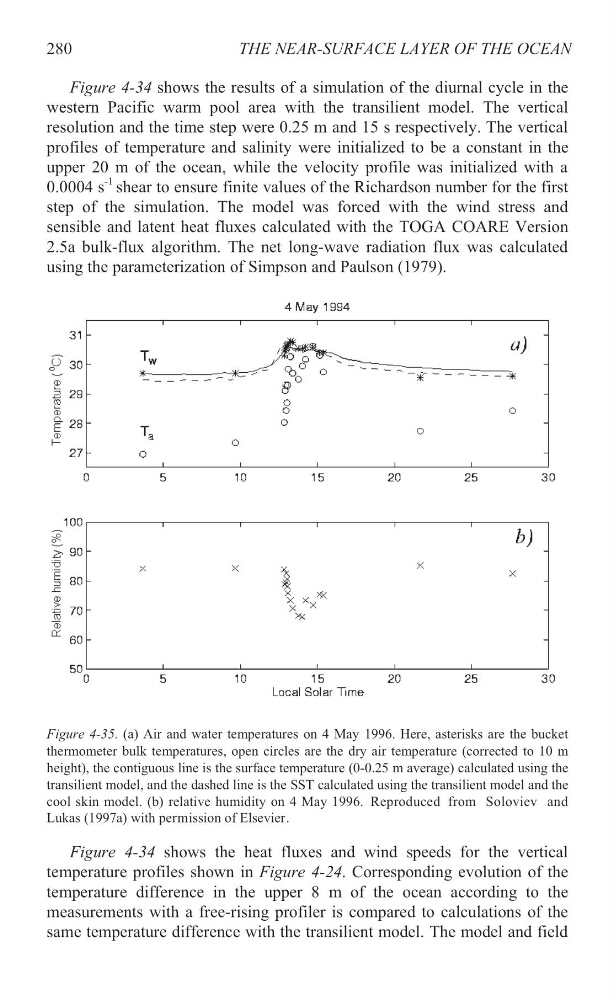
Figure 4-35. (a) Air and water temperatures on 4 May 1996. Here, asterisks are the bucket
thermometer bulk temperatures, open circles are the dry air temperature (corrected to 10 m
height), the contiguous line is the surface temperature (0-0.25 m average) calculated using the
transilient model, and the dashed line is the SST calculated using the transilient model and the
cool skin model. (b) relative humidity on 4 May 1996.
Figure 4-34X shows the heat fluxes and wind speeds for the vertical
temperature profiles shown in X Figure 4-24X . Corresponding evolution of the
temperature difference in the upper 8 m of the ocean according to the
measurements with a free-rising profiler is compared to calculations of the
same temperature difference with the transilient model. The model and field
280
Reproduced from Soloviev and
Lukas (1997a) with permission of Elsevier.
X X Figure 4-34X shows the results of a simulation of the diurnal cycle in the
western Pacific warm pool area with the transilient model. The vertical
resolution and the time step were 0.25 m and 15 s respectively. The vertical
profiles of temperature and salinity were initialized to be a constant in the
upper 20 m of the ocean, while the velocity profile was initialized with a
0.0004 sP
-1
Pshear
to ensure finite values of the Richardson number for the first
step of the simulation. The model was forced with the wind stress and
sensible and latent heat fluxes calculated with the TOGA COARE Version
2.5a bulk-flux algorithm. The net long-wave radiation flux was calculated
using the parameterization of Simpson and Paulson (1979).
Figure 4-35. (a) Air and water temperatures on 4 May 1996. Here, asterisks are the bucket
thermometer bulk temperatures, open circles are the dry air temperature (corrected to 10 m
height), the contiguous line is the surface temperature (0-0.25 m average) calculated using the
transilient model, and the dashed line is the SST calculated using the transilient model and the
cool skin model. (b) relative humidity on 4 May 1996.
Figure 4-34X shows the heat fluxes and wind speeds for the vertical
temperature profiles shown in X Figure 4-24X . Corresponding evolution of the
temperature difference in the upper 8 m of the ocean according to the
measurements with a free-rising profiler is compared to calculations of the
same temperature difference with the transilient model. The model and field
280
Reproduced from Soloviev and
Lukas (1997a) with permission of Elsevier.