

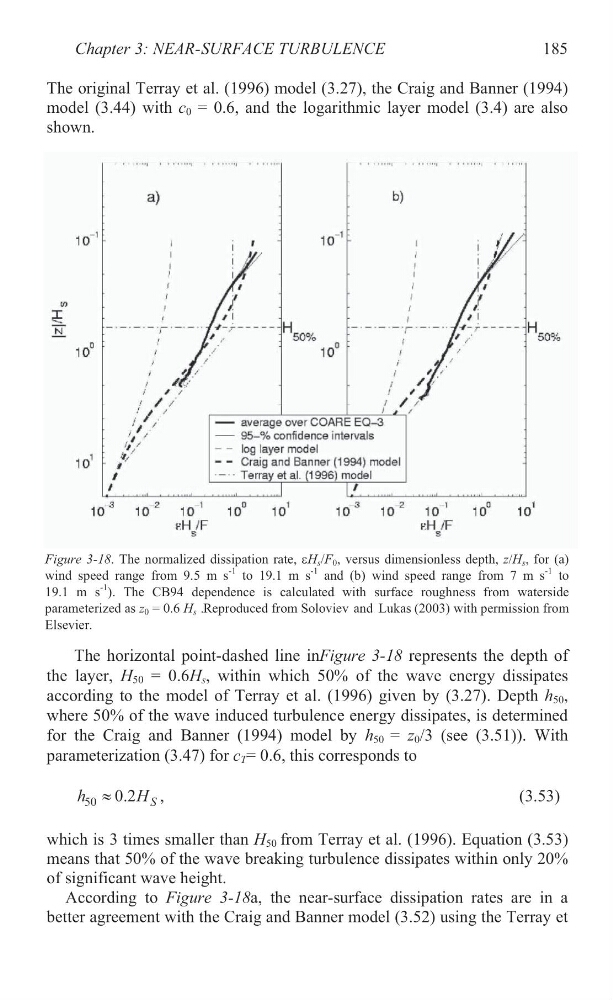
The original Terray et al. (1996) model (3.27), the Craig and Banner (1994)
model (3.44) with c 0 = 0.6, and the logarithmic layer model (3.4) are also
shown.
The horizontal point-dashed line inFigure 3-18 represents the depth of
the layer, H 50 = 0.6H s , within which 50% of the wave energy dissipates
according to the model of Terray et al. (1996) given by (3.27). Depth h 50 ,
where 50% of the wave induced turbulence energy dissipates, is determined
for the Craig and Banner (1994) model by h 50 = z 0 /3 (see (3.51)). With
parameterization (3.47) for c T = 0.6, this corresponds to
50 0.2 S
h
H
|
,
(3.53)
which is 3 times smaller than H 50 from Terray et al. (1996). Equation (3.53)
means that 50% of the wave breaking turbulence dissipates within only 20%
of significant wave height.
According to Figure 3-18a, the near-surface dissipation rates are in a
better agreement with the Craig and Banner model (3.52) using the Terray et
Chapter 3: NEAR-SURFACE TURBULENCE
185
Figure 3-18. The normalized dissipation rate, HH s /F 0 , versus dimensionless depth, z/H s , for (a)
wind speed range from 9.5 m s
-1 to 19.1 m s
-1 and (b) wind speed range from 7 m s
-1 to
19.1 m s
-1 ). The CB94 dependence is calculated with surface roughness from waterside
parameterized as z 0 = 0.6 H s .Reproduced from Soloviev and Lukas (2003) with permission from
Elsevier.
model (3.44) with c 0 = 0.6, and the logarithmic layer model (3.4) are also
shown.
The horizontal point-dashed line inFigure 3-18 represents the depth of
the layer, H 50 = 0.6H s , within which 50% of the wave energy dissipates
according to the model of Terray et al. (1996) given by (3.27). Depth h 50 ,
where 50% of the wave induced turbulence energy dissipates, is determined
for the Craig and Banner (1994) model by h 50 = z 0 /3 (see (3.51)). With
parameterization (3.47) for c T = 0.6, this corresponds to
50 0.2 S
h
H
|
,
(3.53)
which is 3 times smaller than H 50 from Terray et al. (1996). Equation (3.53)
means that 50% of the wave breaking turbulence dissipates within only 20%
of significant wave height.
According to Figure 3-18a, the near-surface dissipation rates are in a
better agreement with the Craig and Banner model (3.52) using the Terray et
Chapter 3: NEAR-SURFACE TURBULENCE
185
Figure 3-18. The normalized dissipation rate, HH s /F 0 , versus dimensionless depth, z/H s , for (a)
wind speed range from 9.5 m s
-1 to 19.1 m s
-1 and (b) wind speed range from 7 m s
-1 to
19.1 m s
-1 ). The CB94 dependence is calculated with surface roughness from waterside
parameterized as z 0 = 0.6 H s .Reproduced from Soloviev and Lukas (2003) with permission from
Elsevier.