

the transfer function of the band-pass filter (shown in Figure 3-9b, curve 3),
and the depth attenuation factor, exp(2 )
k z . The theoretical variance is then
processed via steps a) through d) to obtain an error estimate, H r . The relative
error, H r /H exceeded 10% only in 0.2% of all cases collected during the EQ-3
cruise. These points are removed from the analysis, but this does not affect
the dissipation rate profile averaged over the EQ-3 cruise in any significant
way.
Chapter 3: NEAR-SURFACE TURBULENCE
171
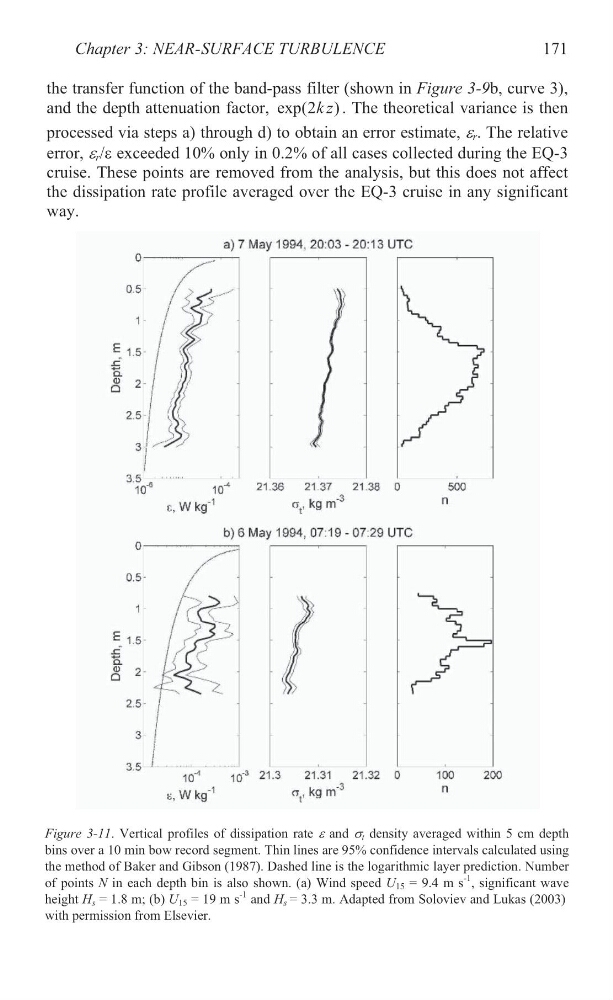
Figure 3-11. Vertical profiles of dissipation rate H and V t density averaged within 5 cm depth
bins over a 10 min bow record segment. Thin lines are 95% confidence intervals calculated using
the method of Baker and Gibson (1987). Dashed line is the logarithmic layer prediction. Number
of points N in each depth bin is also shown. (a) Wind speed U 15 = 9.4 m s
-1 , significant wave
height H s = 1.8 m; (b) U 15 = 19 m s
-1 and H s = 3.3 m. Adapted from Soloviev and Lukas (2003)
with permission from Elsevier.
and the depth attenuation factor, exp(2 )
k z . The theoretical variance is then
processed via steps a) through d) to obtain an error estimate, H r . The relative
error, H r /H exceeded 10% only in 0.2% of all cases collected during the EQ-3
cruise. These points are removed from the analysis, but this does not affect
the dissipation rate profile averaged over the EQ-3 cruise in any significant
way.
Chapter 3: NEAR-SURFACE TURBULENCE
171
Figure 3-11. Vertical profiles of dissipation rate H and V t density averaged within 5 cm depth
bins over a 10 min bow record segment. Thin lines are 95% confidence intervals calculated using
the method of Baker and Gibson (1987). Dashed line is the logarithmic layer prediction. Number
of points N in each depth bin is also shown. (a) Wind speed U 15 = 9.4 m s
-1 , significant wave
height H s = 1.8 m; (b) U 15 = 19 m s
-1 and H s = 3.3 m. Adapted from Soloviev and Lukas (2003)
with permission from Elsevier.